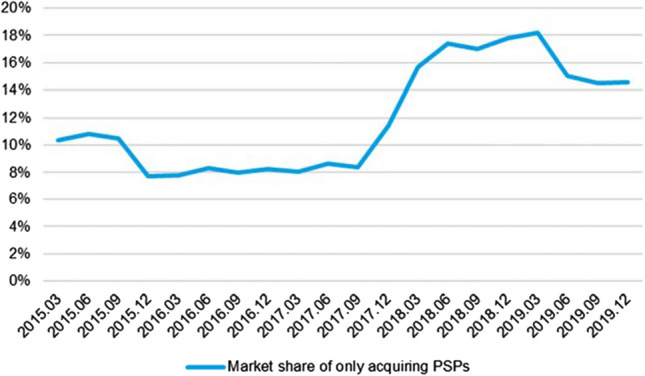
Fig. 5.

Share of those PSPs in Hungary which only acquire transactions (number of transactions) Note Before 2015 less than two PSPs data were available, therefore we cannot publish data due to data-protection reasons. The turnover of cross-border acquirers was also included, since according to market information, the vast majority of these PSPs do not issue cards. The turnover of cross-border acquirers was estimated as the difference between the issuer and acquirer side (see Fig. 1)
Source: Authors’ calculations based on MNB data.
