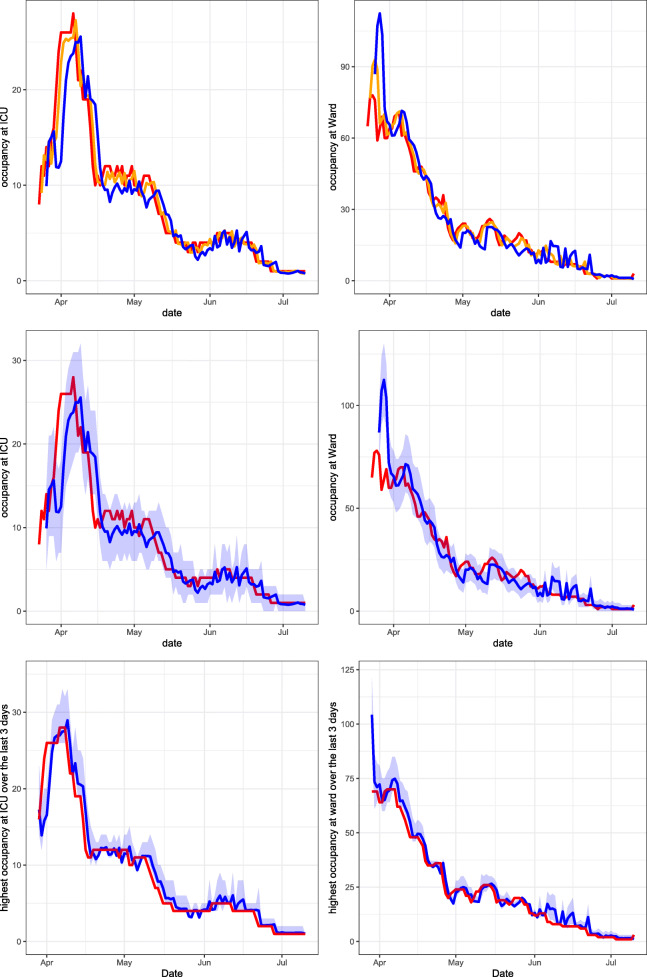
Fig. 6.
Elisabeth-TweeSteden Ziekenhuis March 23, 2020 until July 10, 2020. Top row: expanding window forecasts 1 and 3 days ahead at the COVID-19 ICU (left) and ward (right). Middle row: expanding window forecasts 3 days ahead at the COVID-19 ICU (left) and ward (right), along with a 95% prediction interval. Bottom row: expanding window forecasts of the maximum occupancy, including the 95% prediction interval and realised maximum occupancy of patients at the COVID-19 ICU (left) and ward (right) over the last 3 days. The realised occupancy is shown in red, while the forecasts for 1 and 3 days ahead are shown in orange and blue respectively

