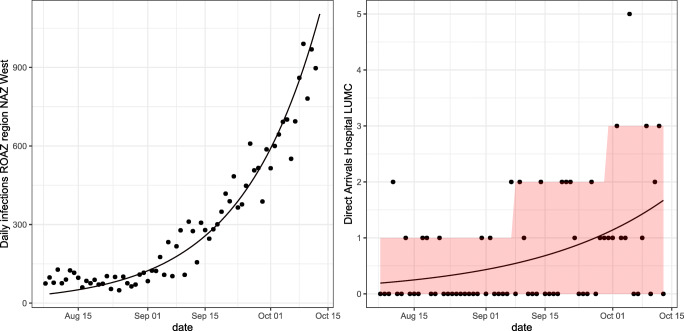
Fig. 8.
Left: the number of daily infections in ROAZ region NAZ West and the trend given by our prediction method using the Richards’ curve fitted on the (cumulative) daily number of infections. Right: the daily number of autonomous direct arrivals to the LUMC. The trend and 80% prediction interval given by our forecasting method using the Richards’ curve fitted on this arrival data is also shown for the LUMC. Both plots are shown for the period starting from 8-07-2020 until 14-10-2020

