
Figure 4.
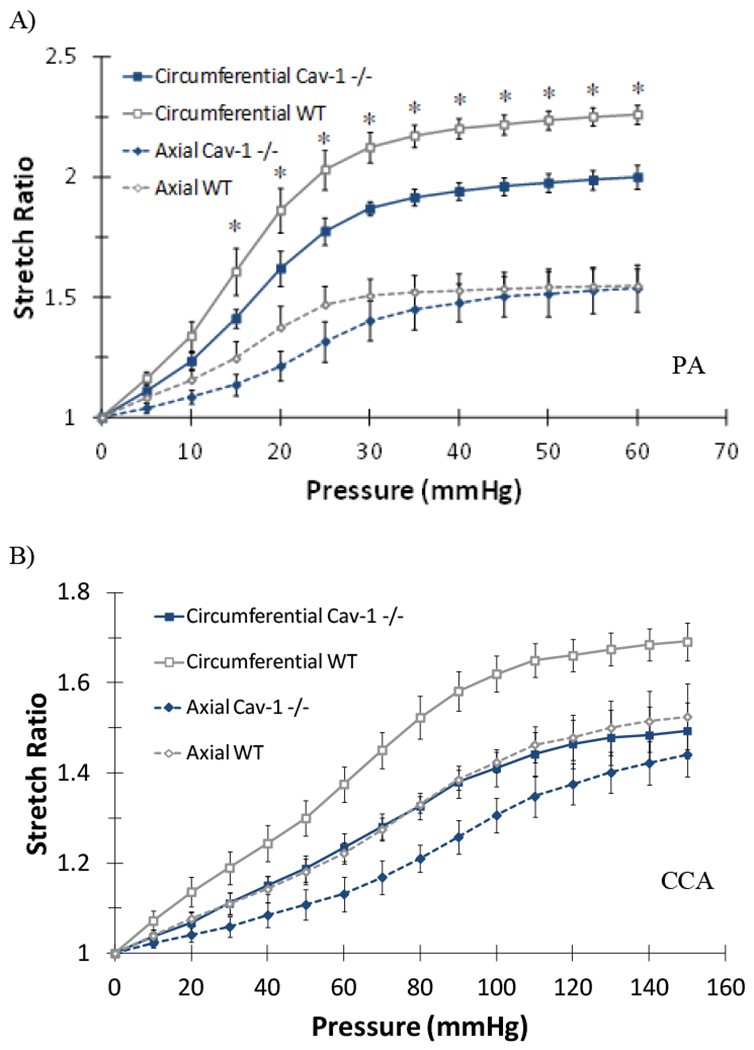
Comparison of pulmonary arteries (PA, A) and common carotid arteries (CCA, B) circumferential and axial stretch ratios plotted as function of lumen pressure of CAV-1−/− and WT 4-6 months groups. Free-end testing. Values are mean ± SD; N=6-7 for PAs and 4-5 for CCAs. For PAs (*) indicate P<.05. For CCAs differences were significant (P<.05) for entire pressure range tested.