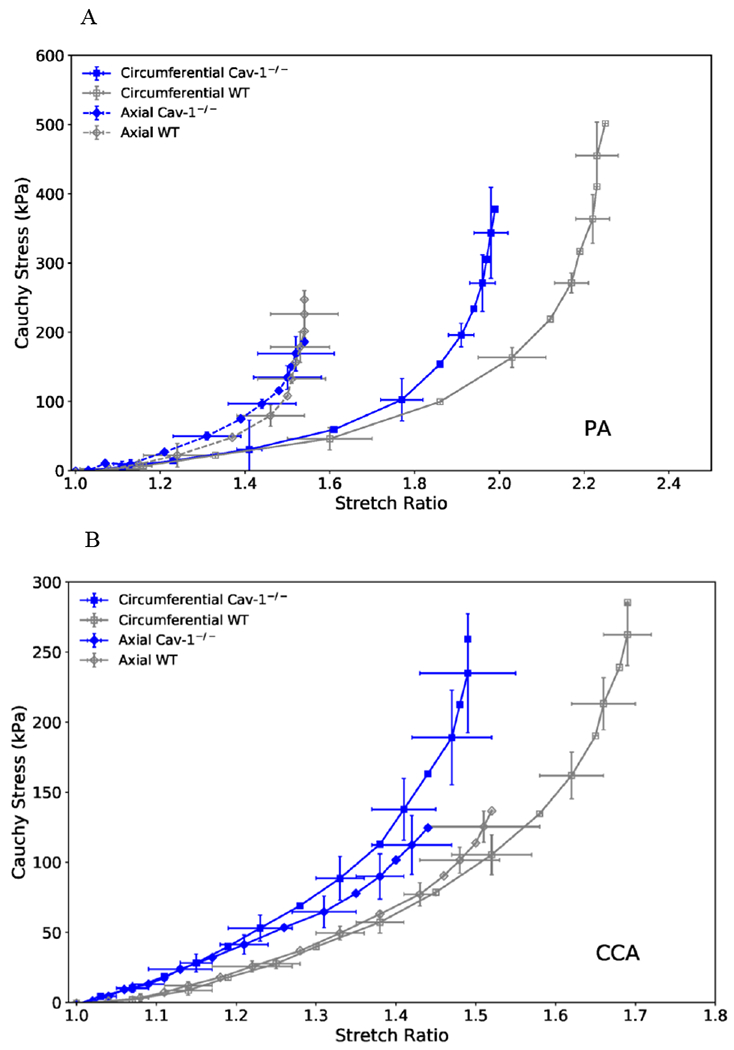
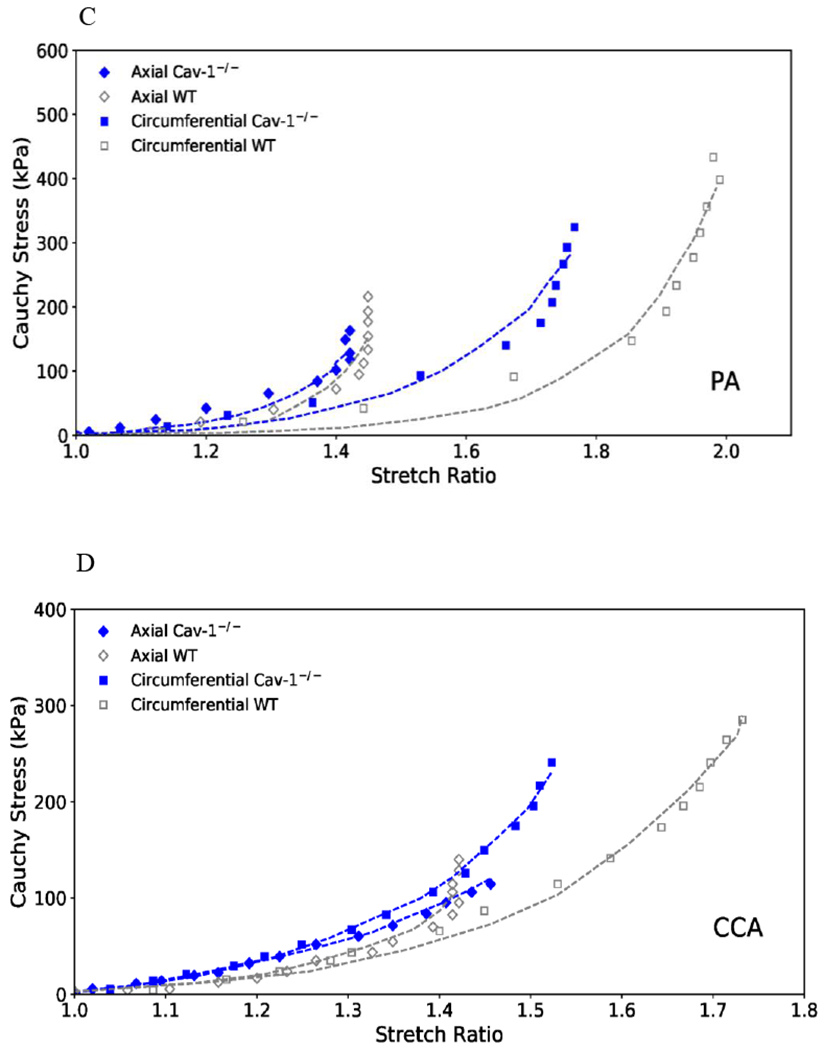
Figure 5.


(A& B): Circumferential (squares) and axial (diamonds) stress plotted as functions of stretch ratio for CAV-1−/− and WT PAs (A) and CCAs (B) of the 4-6 months groups. Free-end testing. Values are mean ± SD; N=6-7 per group. SD is only shown at every other point for clarity.
(C & D): Representative circumferential (square) and axial (diamond) stress-strain relationships of CAV-1−/− (solid blue) and WT (hollow gray) PAs (C) and CCAs (D) of the 4-6 months groups, plotting along with predicted values determined from the Fung two-dimensional strain energy equation (dotted curves). The circumferential curves of CAV-1−/− vessels demonstrated a leftward shift from the WT, indicating increased PA stiffness.
