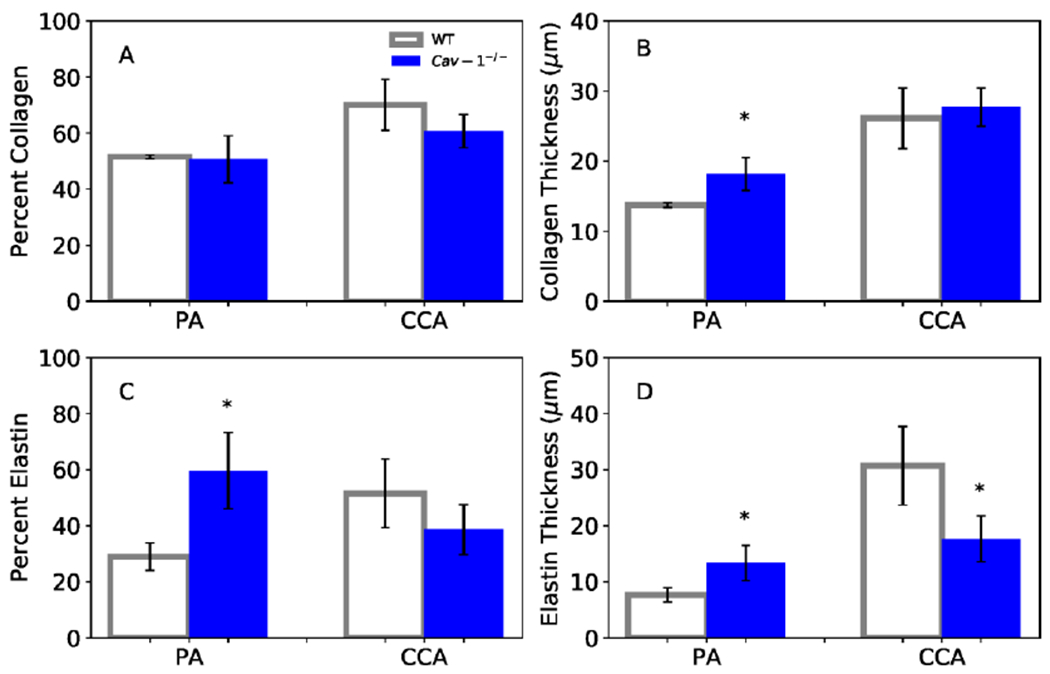
Figure 8.

Collagen and elastin contents (A & C: area ratios; B & D: total amount) for PAs and CCAs at 4-6 months. (*) p<.05 for CAV-1−/− compared to WT. Values are ± SD; N = 5-6 per group.

Collagen and elastin contents (A & C: area ratios; B & D: total amount) for PAs and CCAs at 4-6 months. (*) p<.05 for CAV-1−/− compared to WT. Values are ± SD; N = 5-6 per group.