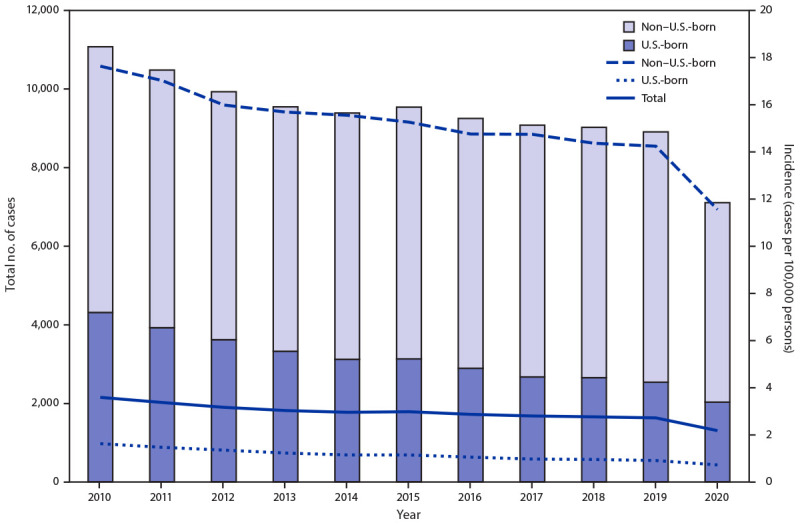
FIGURE.

Tuberculosis disease cases and incidence, by birth origin*,† — United States, 2010–2020
* Numbers of tuberculosis cases among persons with unknown origin are not shown (range = 2–61). Total rate includes cases among persons with unknown national origin.
† Rates for non–U.S.-born and U.S.-born persons were calculated by using midyear Current Population Survey estimates. Total rate was calculated by using midyear population estimates from the U.S. Census Bureau.
