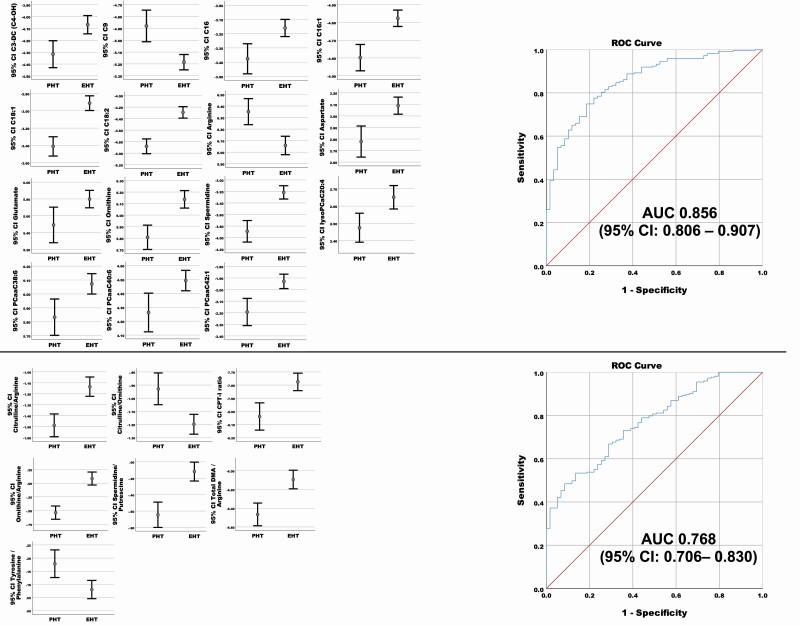
Figure 4.
On the left side concentrations (after generalized logarithmic transformation) of the top 15 significant common metabolites (above) and metabolite ratios (below) of interest found in the comparison of PHT with EHT as common group, after controlling for sex and age group. Medium value with 95% CI of the metabolites (A) and metabolite ratio (B) concentration (after generalized logarithmic transformation) is represented for both groups. On the right side ROC Curve for discrimination between PHT and EHT for panel 2 (metabolites [upper panel] and metabolite ratio [lower panel]) are depicted. The sensitivity (y-axis) and 1-Specificity (x-axis) for different cut-offs for the predicted probabilities of having EHT are represented. The area under the curve (AUC) with the 95% CI is represented for each ROC curve.

