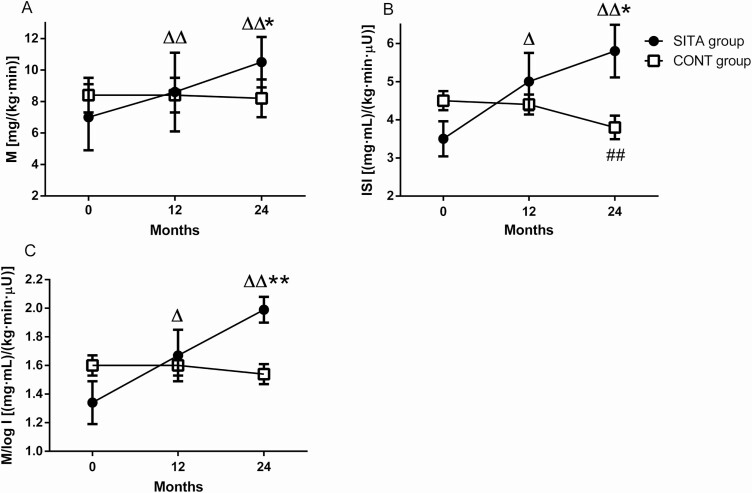
Figure 3.
Insulin sensitivity evaluated by hyperinsulinemic euglycemic clamp. Black circles: SITA group (n=6); white squares: CONT group (n=6). Glucose metabolized (M, A), insulin sensitivity index (ISI, B) and M/log I ratio were calculated at the indicated month. Data were presented as mean and SEM. *P < .05 vs CONT group (MANOVA), △P < .05, △△P < .01 vs the baseline in SITA group and #P < .05, ##P < .01 vs the baseline in CONT group (repeated measures ANOVA).

