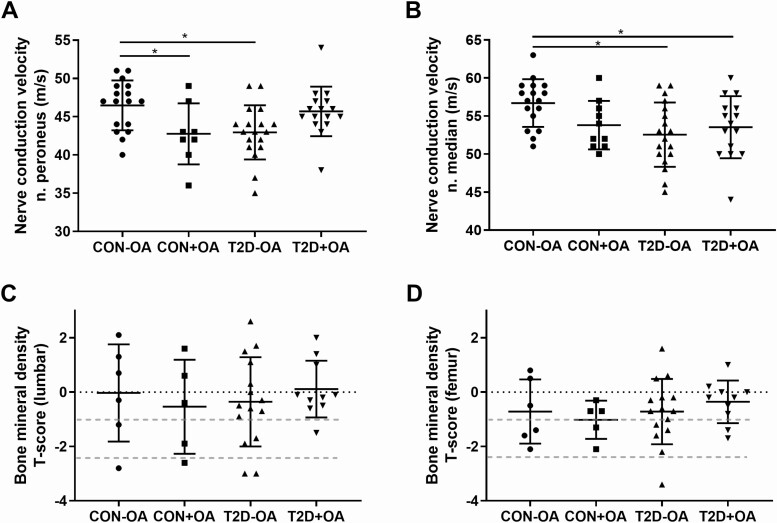
Figure 2.
Parameters of nerve function and bone mineral density. Parameters of nerve and bone function in individuals with normal glucose tolerance and no osteoarthritis (CON-OA, circles), with osteoarthritis (CON+OA, squares), patients with type 2 diabetes without osteoarthritis (T2D-OA, triangles), and with osteoarthritis (T2D+OA, inverted triangles) showing nerve conduction velocity in the A, peroneus nerve, and the B, median nerve; C, bone mineral density in the lumbar spine; and D, the femoral neck. Dotted red lines correspond to the World Health Organization criteria for osteoporosis (T-score < −2.5 SD), osteopenia (T-score from − 1 to − 2.5 SD), and normal (T-score > −1 SD). *P less than or equal to .05.

