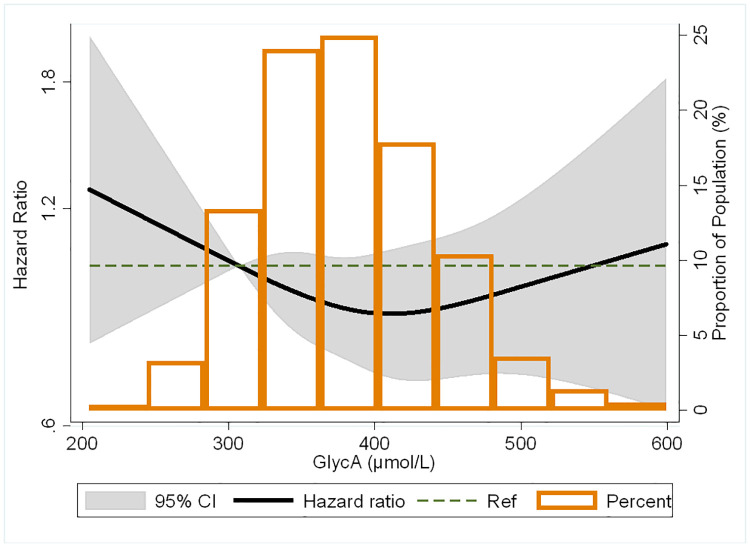
Fig 3. Restricted cubic spline of the association between GlycA and atrial fibrillation adjusted for age, sex, race/ethnicity, MESA field site, education, health insurance, BMI, smoking status, pack-years of smoking, physical activity, systolic blood pressure, use of antihypertensive medication, total cholesterol, HDL-cholesterol, use of lipid-lowering medication, diabetes, eGFR, ln(CRP), ln(IL-6) and ln(fibrinogen).
The black curve represents hazard ratios for atrial fibrillation by proportion of population with the respective GlycA concentration. Grey boundaries represent the 95% CI of the hazard ratios. Knots were at the 5th, 35th, 66.5th, and 95th percentiles which correlates to GlycA levels of 289.8, 353.1, 400.2, and 488.8 μmol/L, respectively.

