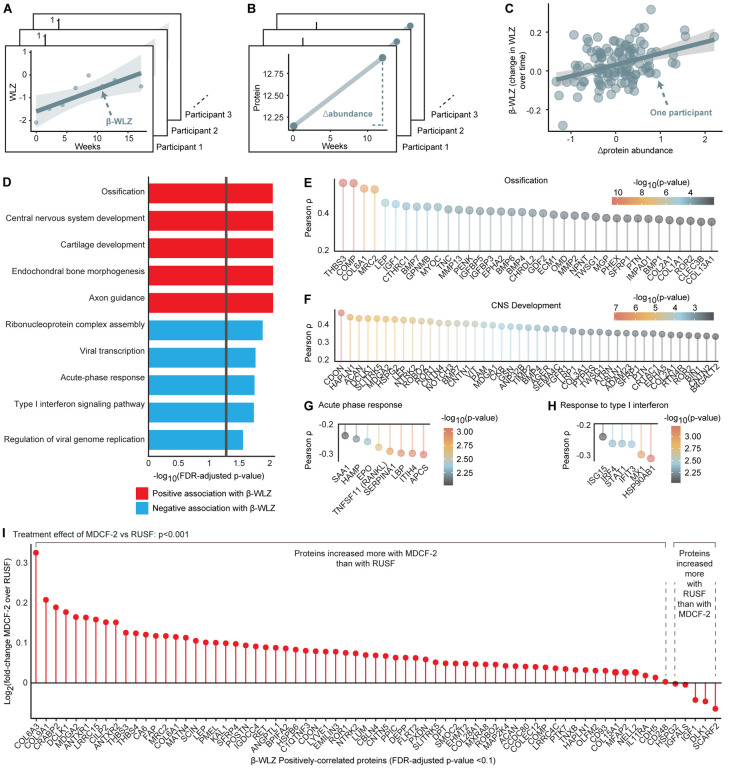
Fig. 2: Effects of Nutritional Intervention on Plasma Proteins.
(A-C) Schematic depicting the calculation of ‘β-WLZ’ for each participant (panel A), ‘Δprotein abundance’ for each participant (panel B) and the correlation between these two values (panel C). (D) Gene set enrichment analysis (GSEA) of proteins whose abundances were correlated with ponderal growth. The vertical gray line indicates q<0.05. (E-H) Gene Ontology (GO) terms enriched for by the set of WLZ-associated proteins. Shown are the correlation strengths between proteins belonging to a GO term and ponderal growth. Only proteins whose correlations with β-WLZ reached an unadjusted p<0.01 are shown. Proteins are ordered by correlation strength and colored by their p-value (transformed to a −log10 scale so that decreasing values indicate less statistical significance). (I) Differential effects of MDCF-2 and RUSF on WLZ-associated proteins. Proteins are ordered by the log2(fold-change) of the treatment effect of MDCF-2 over RUSF after three months of supplementation. GSEA was used to calculate the enrichment of proteins whose abundances were increased more by MDCF-2 compared to RUSF for the set of 70 proteins that are positively correlated with β-WLZ.

