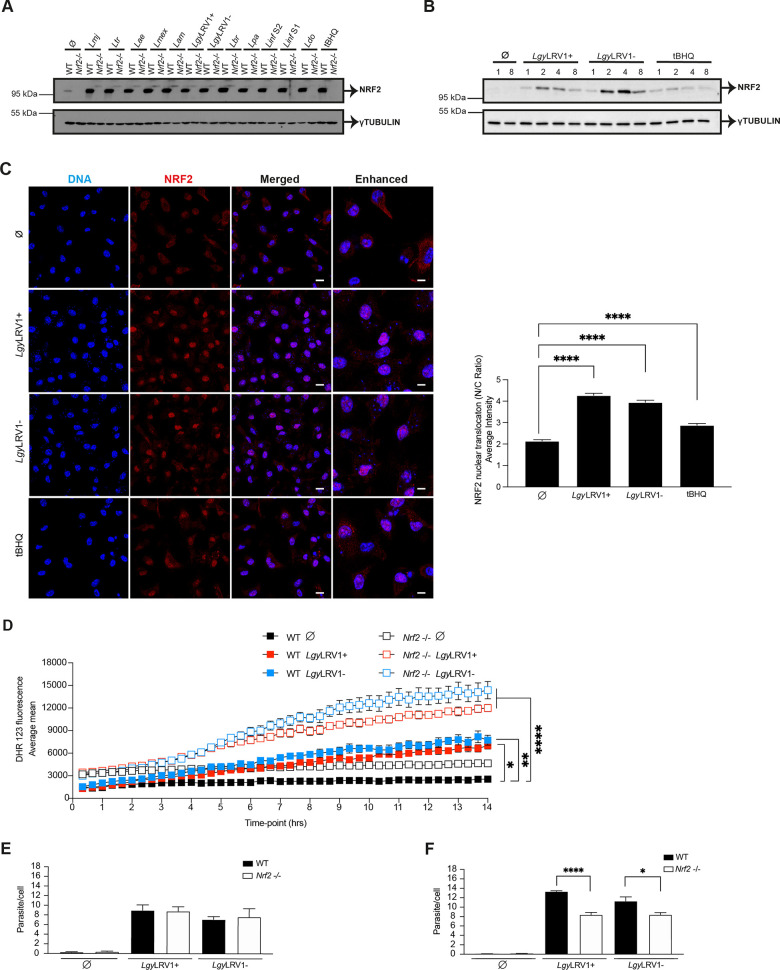
Fig 1. The infection of macrophages with Leishmania spp. leads to upregulation of NRF2 pathway.
A) Western blot analysis of WT and Nrf2-/- BMDMs infected with Lmj, Ltr, Lae, Lmex, Lam, LgyLRV1+, LgyLRV1-, Lbr, Lpa, Linf S1, Linf S2 or Ldo parasites for 4 hrs. Analysis of non-treated (Ø) or tBHQ-treated (10 μM) cells were performed concomitantly. Cells lysates were tested with anti-NRF2 and anti-γTUBULIN antibodies. B) WT BMDMs infected with LgyLRV1+ or LgyLRV1- parasites for 1, 2, 4 or 8 hrs, or stimulated with medium (Ø), or tBHQ (10 μM) were analyzed by immunoblotting with anti-NRF2 and anti-γTUBULIN antibodies. C) Immunofluorescence and quantification of NRF2 nuclear translocation expressed as nucleus/cytoplasm (N/C) ratio in WT BMDMs. Cells were stained with NRF2 (red), DAPI (blue) after 8 hrs of infection with LgyLRV1+ or LgyLRV1- parasites, or stimulated with medium (Ø), or tBHQ (10 μM) and imaged at 63x using a confocal microscope. Scale bar represents 10 and 40 μm for merged and enhanced images, respectively. NRF2 nuclear translocation was quantified for each cell (N = 100–160) using IMARIS software. D) Intracellular levels of ROS in CFSE labelled WT and Nrf2-/- cells infected with LgyLRV1+ or LgyLRV1- parasites or treated with medium (Ø) assessed using DHR 123 time-lapse microscopy. Cells were imaged at 20x for 14 hrs. ROS quantification was determined by Image J software using CFSE and DHR 123 staining. E) and F) Intracellular parasite load in WT and Nrf2-/- cells infected with LgyLRV1+ or LgyLRV1- parasites at 8 hrs (E) or 24 hrs (F) stained with DAPI and imaged at 40x using a high-content microscope. Parasite and cell quantification were assessed using MetaXpress software. Representative blots (A-B) from three independent experiments are shown. Representative images (C) and quantification (C and D) from one of three independent experiments are shown. Data are expressed as mean ± SEM. Statistical significance was calculated by performing two-way ANOVA analysis with Bonferroni’s post-test (D) and unpaired Student’s t test (C and F). * p < 0.05, ** p < 0.01 and **** p < 0.0001. See also S1 Fig.

