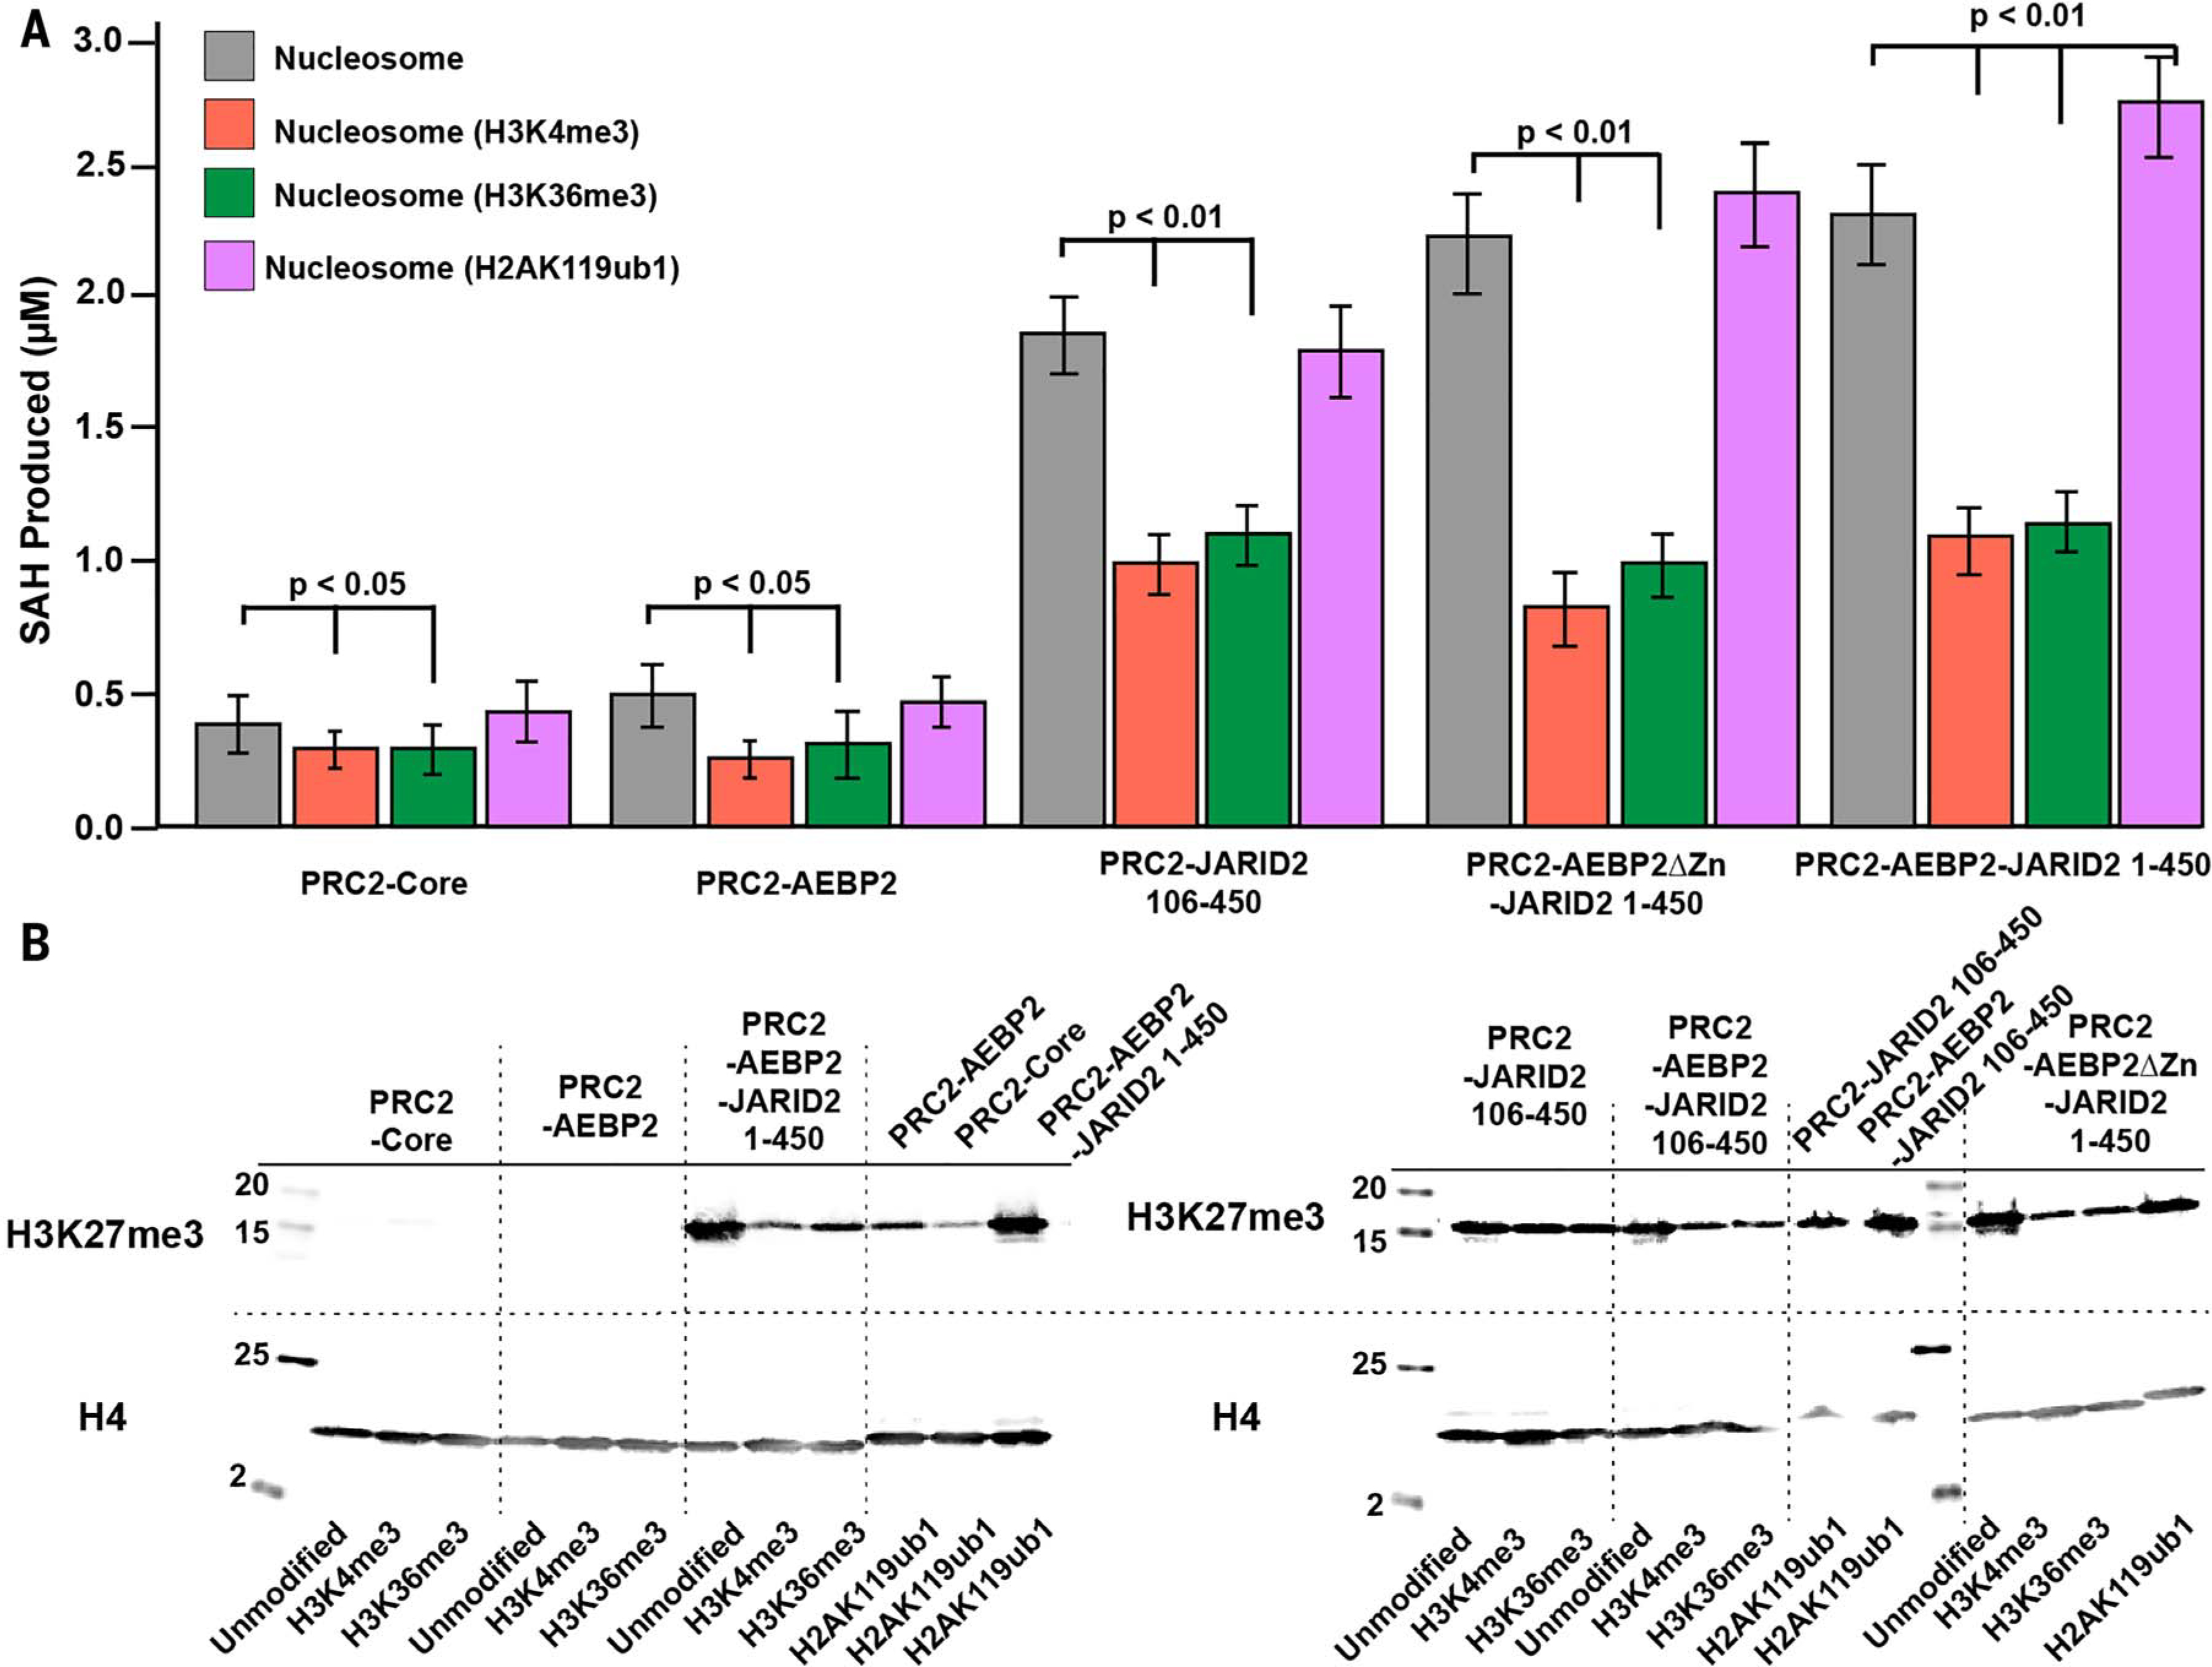
Fig. 4. HMTase activity of different PRC2 complexes on modified nucleosomes.

(A) Bar graph showing the comparison of end-point, cumulative HMTase activity (H3K27me1/me2/me3) of PRC2-core, PRC2-AEBP2, PRC2-JARID2 (amino acids 106 to 450), PRC2-AEBP2ΔZn-JARID2 (amino acids 1 to 450), and PRC2-AEBP2-JARID2 (amino acids 1 to 450) on unmodified nucleosomes (gray), H3K4me3-containing (orange), H3K36me3-containing (green), and H2AK119ub1-containing nucleosomes (magenta). The differences in end-point measurements that are statistically significant are indicated by the P values. (B) Western blot analysis comparing the H3K27me3 production for unmodified nucleosomes versus the H3K4me3-containing, H3K36me3-containing, and H2AK119ub1-containing nucleosomes.
