
FIGURE 3.
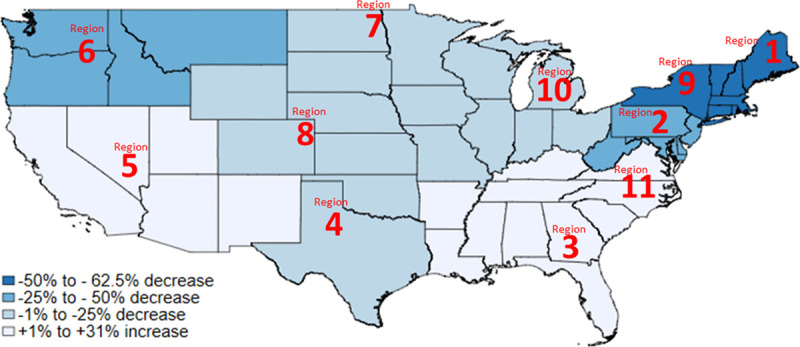
Heat map demonstrating percent change in the number of lung transplants performed in each United Network for Organ Sharing (UNOS) region between March 1, 2020, and May 30, 2020, compared with the preceding 5 y.
Official websites use .gov
A
.gov website belongs to an official
government organization in the United States.
Secure .gov websites use HTTPS
A lock (
) or https:// means you've safely
connected to the .gov website. Share sensitive
information only on official, secure websites.
Heat map demonstrating percent change in the number of lung transplants performed in each United Network for Organ Sharing (UNOS) region between March 1, 2020, and May 30, 2020, compared with the preceding 5 y.