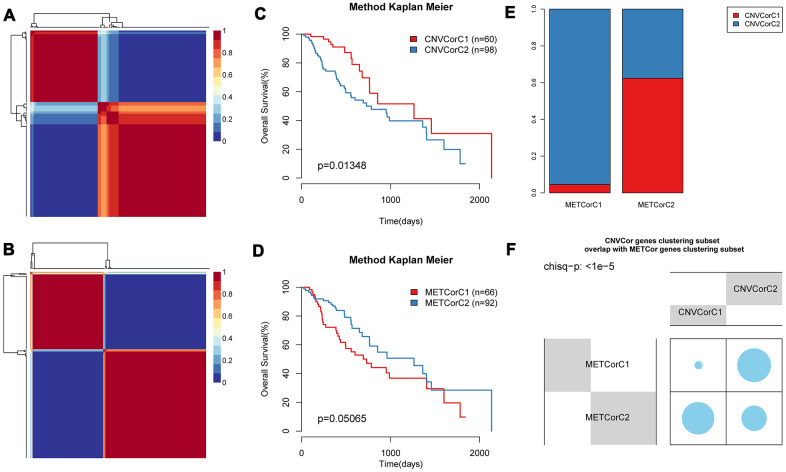
Figure 4.
Identification of molecular subtypes of CNV-G and MET-G genes. NMF clustering results of (A) CNV-Gs and (B) MET-Gs were demonstrated, and survival proportions of (C) CNV-Gs and (D) MET-Gs were shown by Kaplan-Meier curves. (E, F) The overlapping between the subtypes of CNV-G clustering and the subtypes of MET-G clustering.

