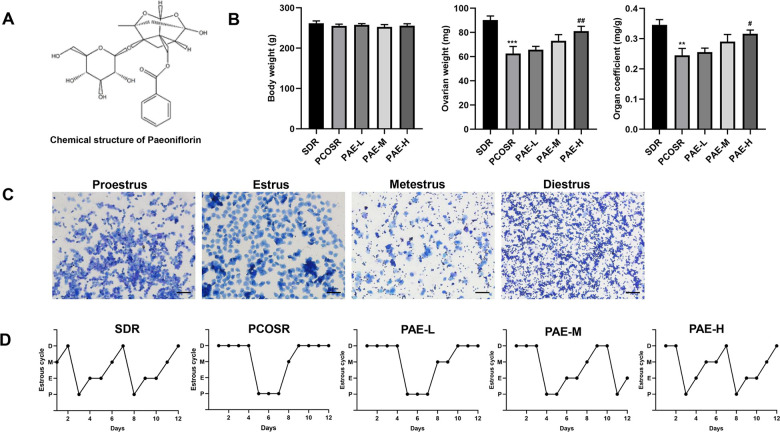
Figure 1.
Influence of PAE on body weight, ovary weight, organ coefficient and estrous cycle in PCOS rats (n=10 for each group). (A) The chemical structure of PAE. (B) Influence of PAE on body weight, ovary weight and organ coefficient in PCOS rats (mean ± SEM, n=10 for each group). *P < 0.05, **P < 0.01 and ***P < 0.001 vs. SDR group. #P < 0.05, ##P< 0.01 and ###P< 0.01 vs. PCOSR group. (C) Different periods of estrous cycle (toluidine blue staining; Scale bars = 200 μm): Proestrus, Estrus, Metestrus and Diestrus. (D) Representative pictures of estrous cycle in five different groups; P, Proestrus; E, Estrus; M, Metestrus; D, Diestrus. PCOS, polycystic ovarian syndrome; SDR, normal control group; PCOSR, PCOS model group; PAE-L, PAE low-dose group (20 mg/kg/d); PAE-M, PAE middle-dose group (40 mg/kg/d); PAE-H, PAE high-dose group (80 mg/kg/d).

