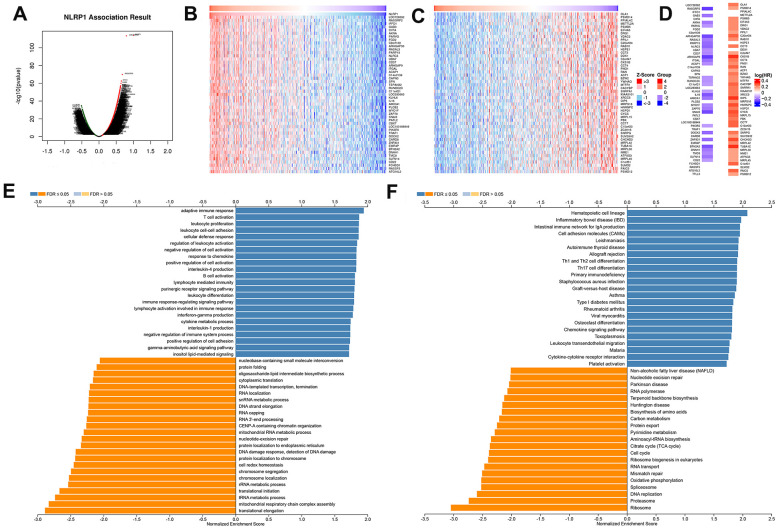
Figure 4.
NLRP1-coexpressed genes in TCGA-LUAD cohort (LinkedOmics). (A) All genes highly associated with NLRP1 identified by Pearson correlation test in the LUAD cohort. (B, C) Heatmaps respectively show the top 50 genes positively and negatively correlated with NLRP1 in LUAD. Red indicates positively correlated genes, and blue indicates negatively correlated genes. (D) Survival map of the top 50 genes positively or negatively correlated with NLRP1 in LUAD. (E, F) Significantly enriched GO annotations and KEGG pathways of NLRP1 in LUAD cohort. FDR: false discovery rate.

