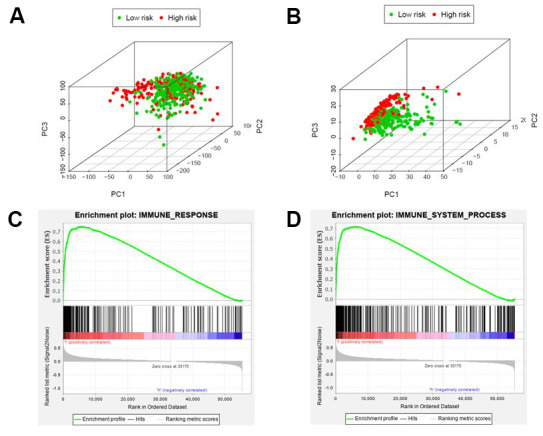
Figure 4.

Different immune status in high-risk and low-risk groups. Principal components analysis between high-risk and low-risk groups based on all genes (A) or immune-related genes (B). Enrichment analysis of genes related to immune response (C) or immune system process (D), which shows gene sets enriched in the low-risk group. NSE: Normalized Enrichment Score.
