Figure 2.
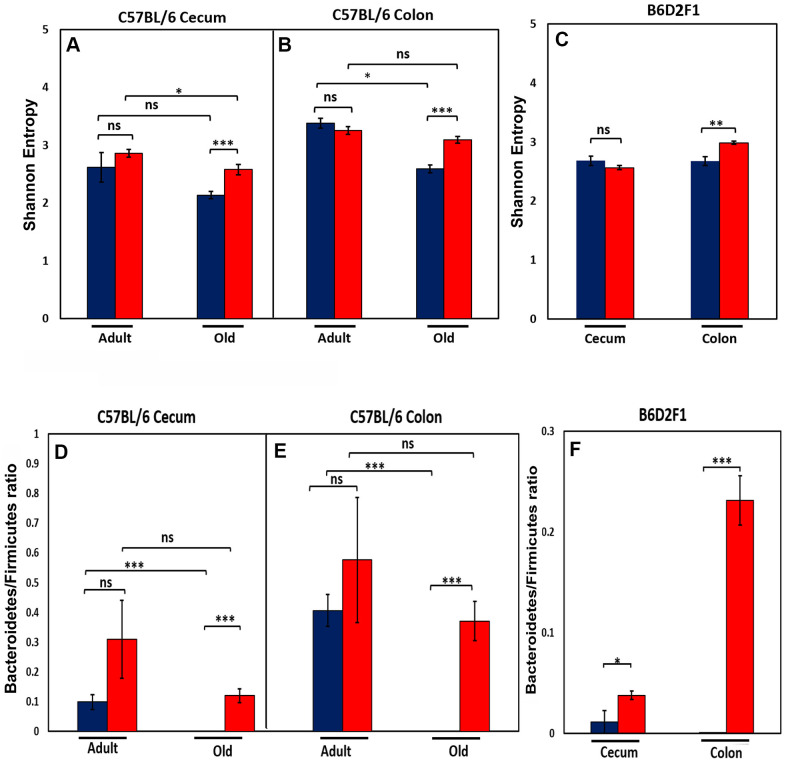
Effect of age and CR on microbiome. The top panel show the Shannon diversity index (Wagner et al., 2018) for the cecum (A) and colon (B) of adult and old C57BL/6JN mice and old B6D2F1 mice (C) fed AL (blue bars) or CR (red bars). The bottom panel show the ratio of Bacteroidetes to Firmicutes for the cecum (D) and colon (E) of adult and old C57BL/6JN mice and for the cecum and colon of old B6D2F1 (F) mice fed AL (blue bars) or CR (red bars). The data represent the mean and SEM for 8- 10 mice per group. *p<0.05, **p<01, ***p<0.001, ns = non-significant.

