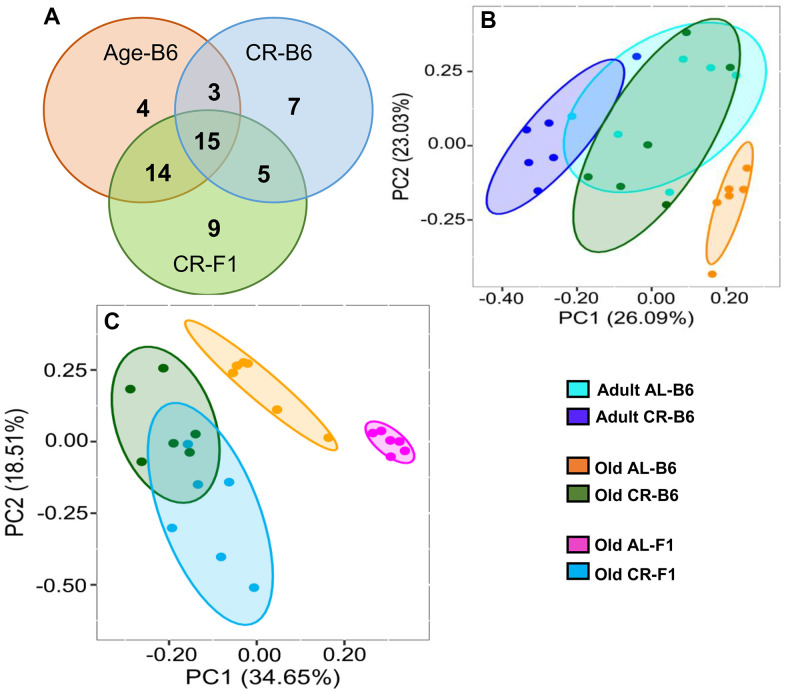
Figure 7.
Effect of age and CR on the fecal metabolome. (A) Venn diagram showing the distribution of the number of metabolites that changed significantly in C57BL/6JN mice with age (orange) or with CR in old C57BL/6JN mice (blue) or changed significantly with CR in B6D2F1 mice (green). (B) PCA Analysis of fecal metabolites from adult and old C57BL/6JN mice fed AL or CR (6 mice/group). Data normalized and imputed from the 98 metabolites. (C) PCA Analysis of fecal metabolites from old AL and CR C57BL/6JN and B6D2F1 mice (6 mice/group) normalized and imputed from the 98 metabolites.

