Figure 9.
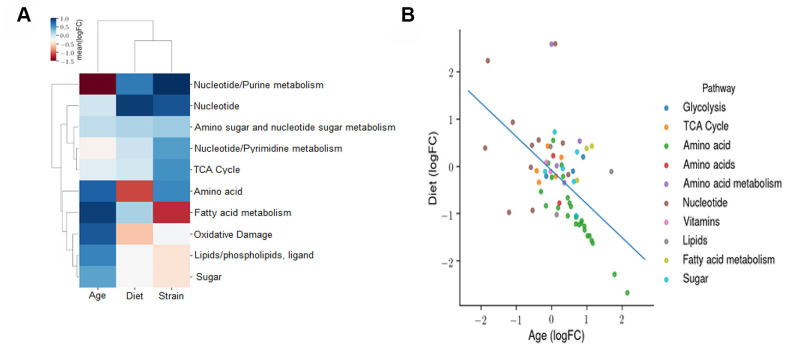
Effect of age, diet, and strain on the fecal metabolome. (A) An ordinary least squares (OLS) linear model with the formula *log (Abundance) ~ Age + Diet + Strain* is fitted to evaluate the effects of age, diet, and strain on the metabolomic profile. The coefficients of this model reflect the independent fold changes on metabolomic abundances caused by age, diet, and strain. This panel displays the average log2FC attributable to age, diet, and strain among all the metabolites measured in the respective pathways. A positive value for age, diet, or strain indicates that this metabolomic pathway is increased with age, DR, or B6D2F1 (versus C57BL/6JN), respectively. (B) OLS linear model coefficients reflecting the independent fold changes in metabolomic abundances caused by age and diet. The average log2FC attributable to age and diet among all the metabolites measured in the respective pathways are shown. A positive value for age or diet indicates that this metabolomic pathway is increased with age or CR, respectively.

