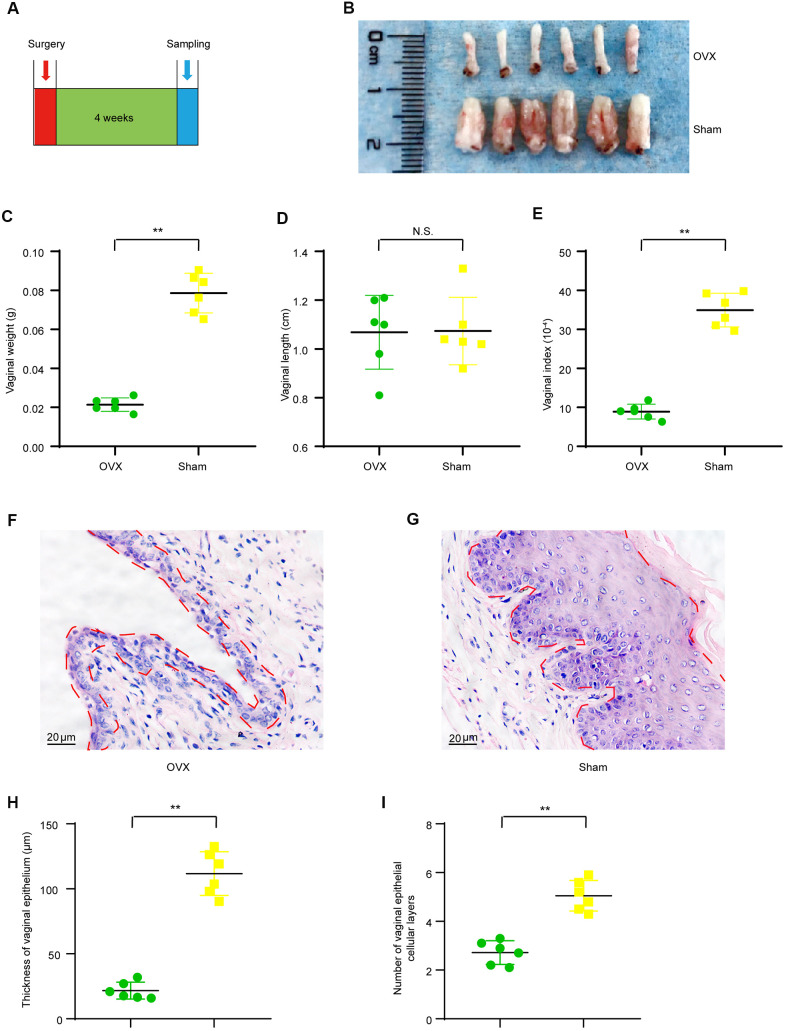
Figure 1.
Vaginal morphologic changes in OVX group and Sham group mice. (A) The timeline for ovariectomy and sham surgery, fecal and vaginal tissue samples collection. (B) Representative images for isolated vagina of OVX group and Sham group. (C) Vaginal weight (t-test, P<0.05). (D) Vaginal length (t-test, P>0.05). (E) Vaginal index (vaginal weight/body weight*10-4) (t-test, P<0.05). (F, G) Representative image of Hematoxylin-Eosin staining for vaginas and the area delineated by the red dotted line indicating the epithelial layer of the vagina. (H) Average vaginal epithelial thickness (t-test, P<0.05). (I) Average number of vaginal epithelial cellular layers (t-test, P<0.05). Data are shown as mean ± SEM, n=6 for each group,*P < 0.05, **P < 0.01. OVX : bilateral ovariectomy group; Sham : sham operation group.

