Figure 4.
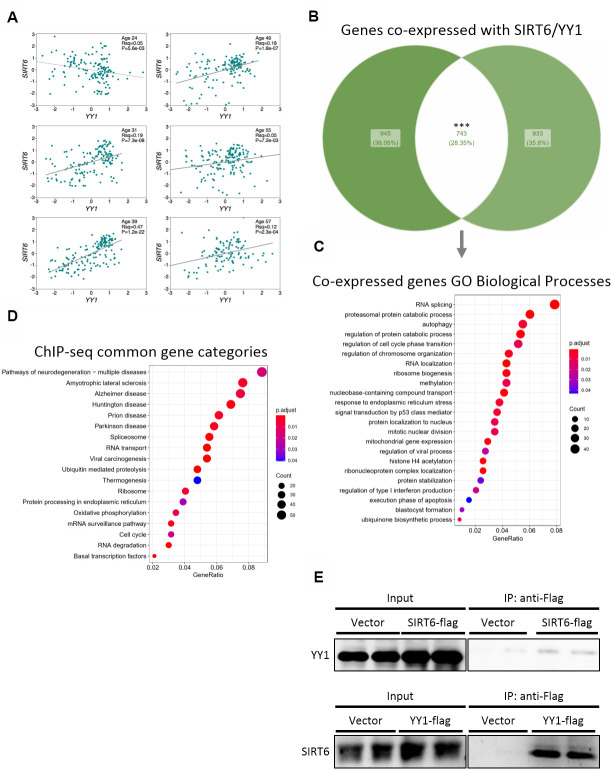
SIRT6 and YY1 present high similarity in targets. (A) Expression correlations in brains of 6 different donors, based on Allen Brain Atlas microarray data. Each graph is of a different donor and each point on the graph is a different spot of the donor’s brain. (B) Venn diagram of the top 2000 genes co-expressed with either SIRT6 or YY1, and their overlapping. (C) Enriched GO Biological Processes categories the overlapping genes are part of. (D) KEGG enrichment analysis of genes that present peaks in both SIRT6 and YY1 ChIP-seq data (2 cell lines per protein). (E) Western blots of co-immunoprecipitation experiments of SIRT6 and YY1. *** - p-value<0.001.

