
Figure 3: Estimates of mixture proportions using qpAdm.
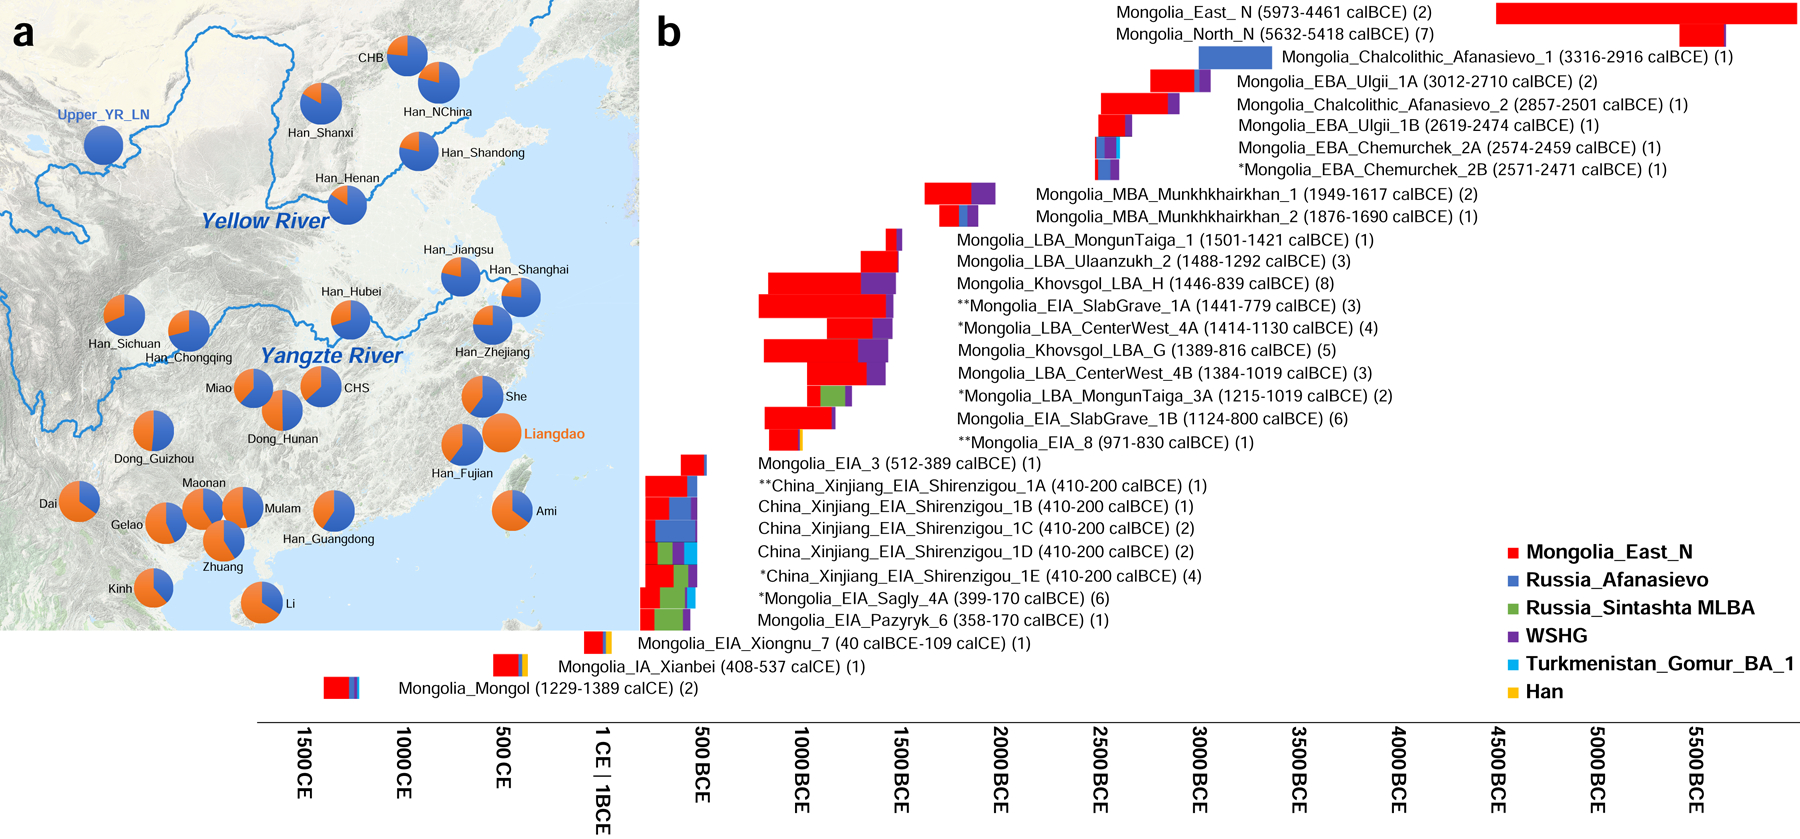
(a) qpAdm modelling of Yellow River farmer (blue) and Liangdao-related ancestry (orange) in present-day East Asians, with numbers from Online Table 22, and plotted using the “Google Map Layer” from ArcGIS Online Basemaps (Map data ©2020 Google). (b) Mongolians and Xinjiang. As sources we explored all possible subsets of Mongolia_East_N, Afanasievo, WSHG, Sintashta_MLBA, Turkmenistan_Gonur_BA_1, and Han Chinese, adding all groups to the reference set when not used as sources, and identifying parsimonious models (fewest numbers of sources) that fit at P>0.05 based on the Hotelling T2 test implemented in qpAdm (Online Table 25). These P-values do not incorporate any correction for multiple hypothesis testing. * indicates parsimonious models that only pass at P>0.01. ** indicates cases where multiple equally parsimonious models pass at P>0.05 so we can not determine whether the West Eurasian-related source was Afanasievo, WSHG, or Sintashta_MLBA (we plot the model with the largest p-value). Bars show ancestry proportions, and time spans are unions of all samples. We do not visualize results from singleton outliers.