
Extended Data Figure 6|. Admixture graph model.
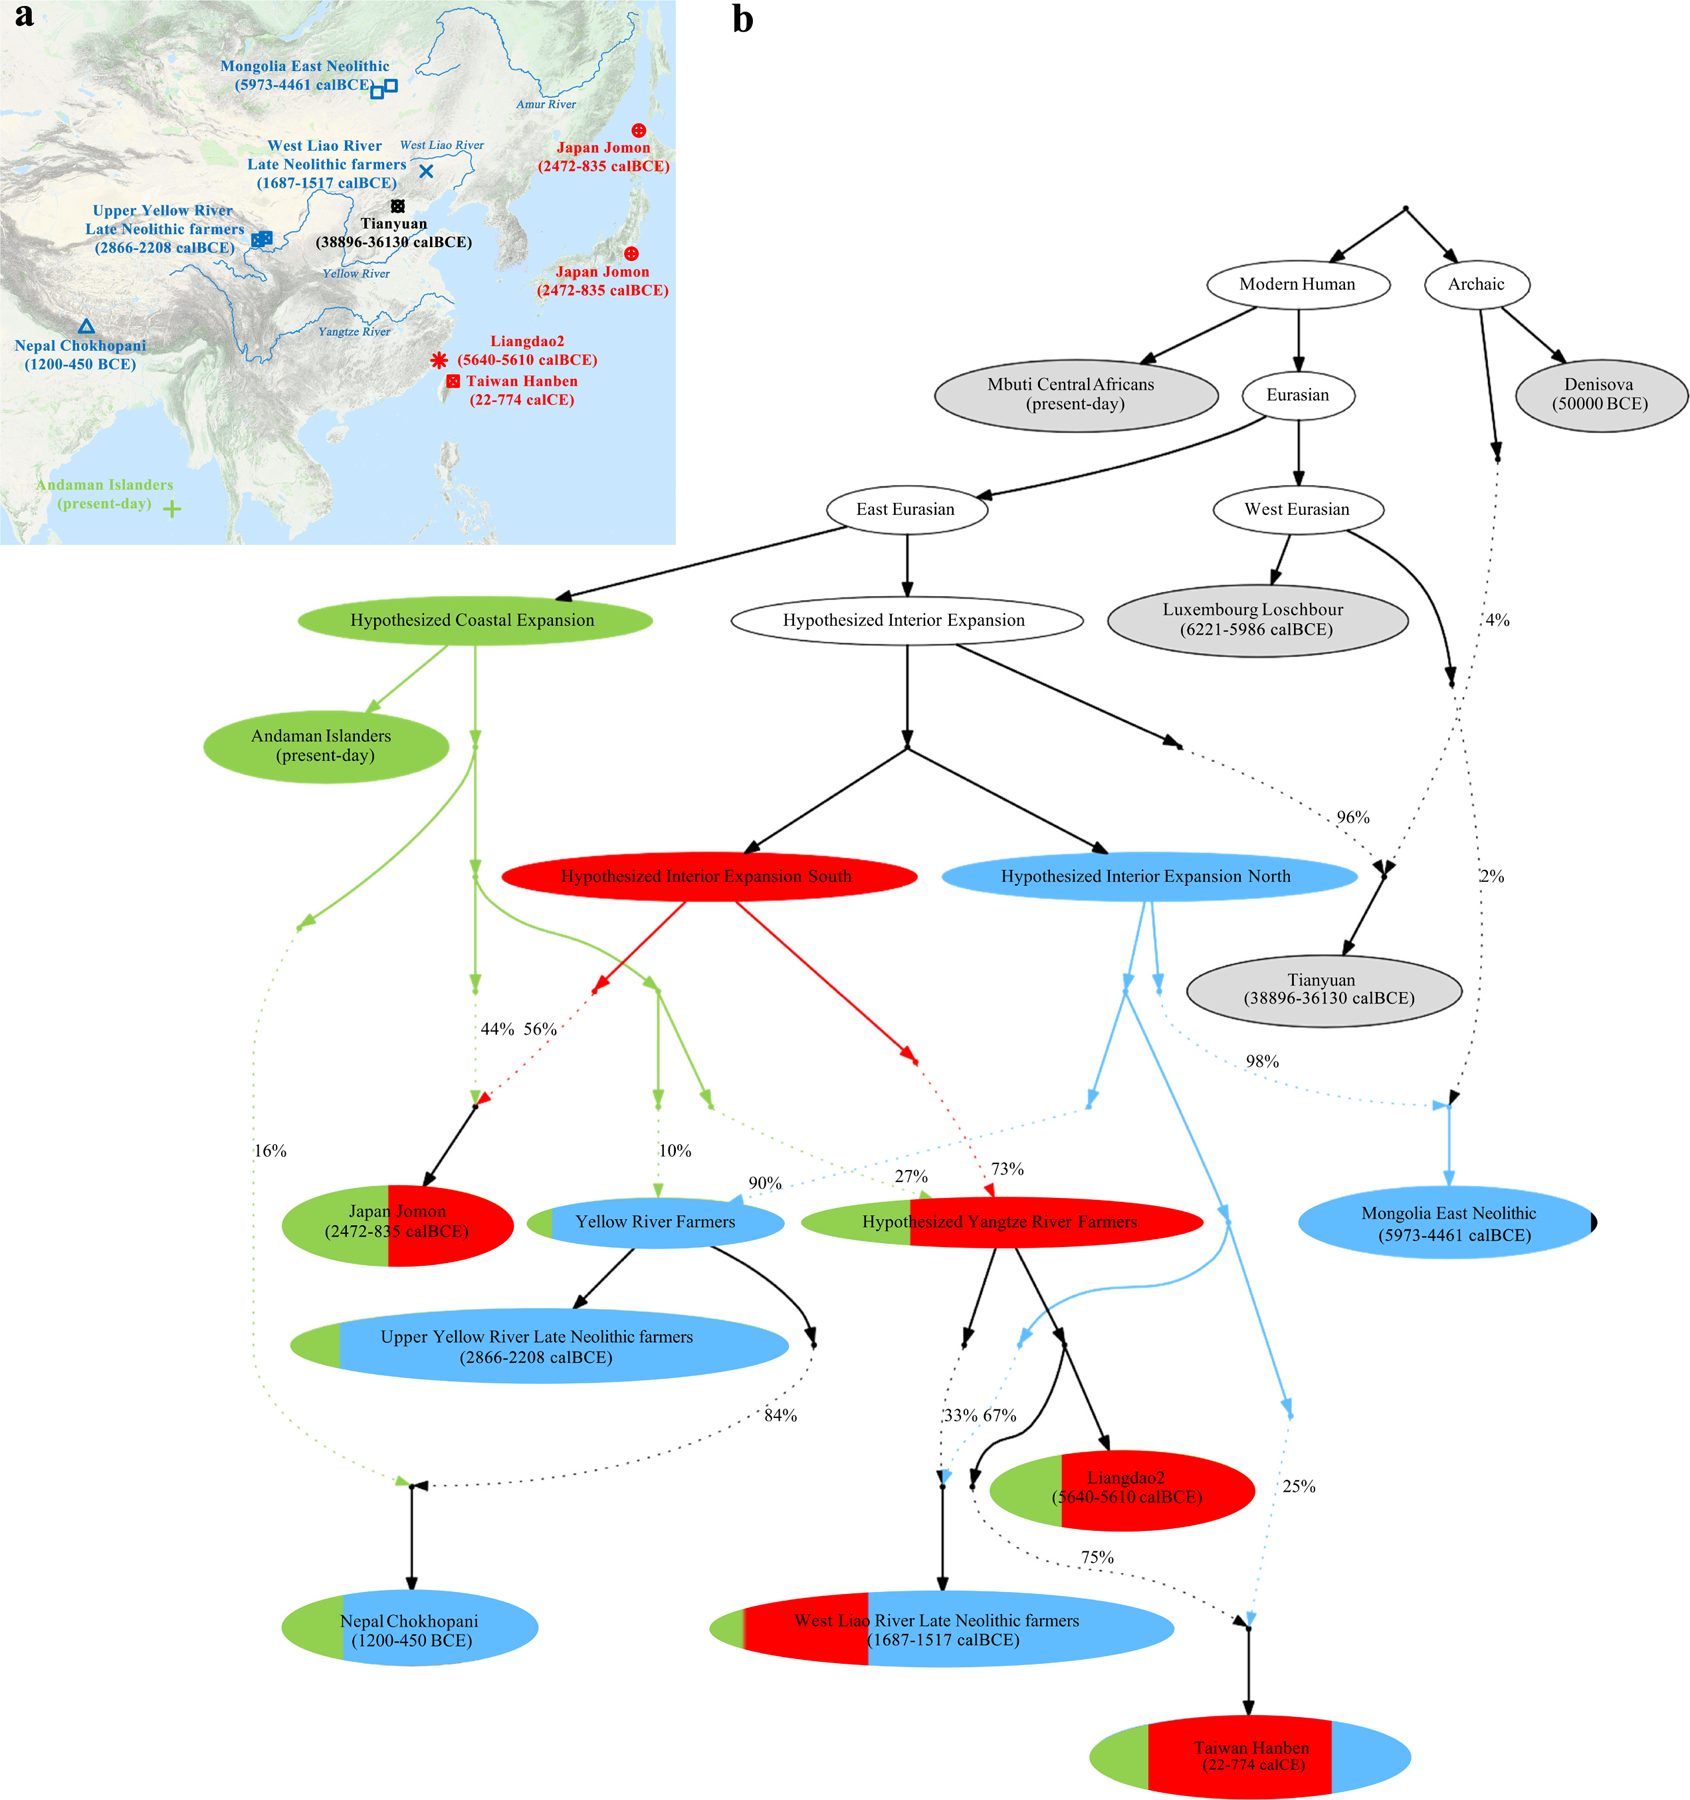
(This is the same as Figure 2 except that we show the fitted genetic drifts on each lineage.) We used all available sites in the 1240K dataset, restricting to transversions only to confirm that the same model fit (Supplementary Information section 3). We started with a skeleton tree that fits the data for Denisova, Mbuti, Onge, Tianyuan and Luxembourg Loschbour and one admixture event. We grafted on Mongolia East Neolithic, Upper Yellow River Late Neolithic farmers, Liangdao2, Japan Jomon, Nepal Chokhopani, Taiwan Hanben, and West Liao River Late Neolithic farmers in turn, adding them consecutively to all possible edges in the tree and retaining only graph solutions that provided no differences of |Z|<3 between fitted and estimated statistics (maximum |Z|=2.95 here). We used the MSMC and MSMC2 relative population split time estimates to constrain models. Deep splits are not well constrained due to minimal availability of Upper Paleolithic East Asian data. (a) Locations and dates of the East Asian individuals used in model fitting, with colours indicating whether the majority ancestry is from the hypothesized coastal expansion (green), interior expansion south (red), and interior expansion north. The map is based on the “Google Map Layer” from ArcGIS Online Basemaps (Map data ©2020 Google). (b) In the model visualization, we color lineages modelled as deriving entirely from one of these expansions, and also color populations according to ancestry proportions. Dashed lines represent admixture (proportions are marked), and we show the amount of genetic drift on each lineage in units of FST x 1000.