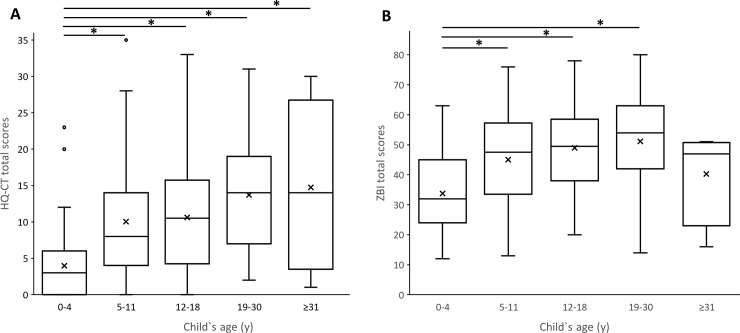
Fig 1.
HQ-CT total scores (A) and ZBI total scores (B) vary with the age of individuals with PWS. Box-and-whisker plots showed the range of HQ-CT total scores (left) and ZBI total scores (right) in function of individual’s age groups (*p < 0.05). Within the boxplot, the mean value is represented by the black cross, the median by the horizontal dividing line, and the top and bottom of the box represent the seventy-fifth and twenty-fifth percentile, with the whiskers indicating the maximum and minimum points and outlier points shown as small empty circles.

