Fig 6.
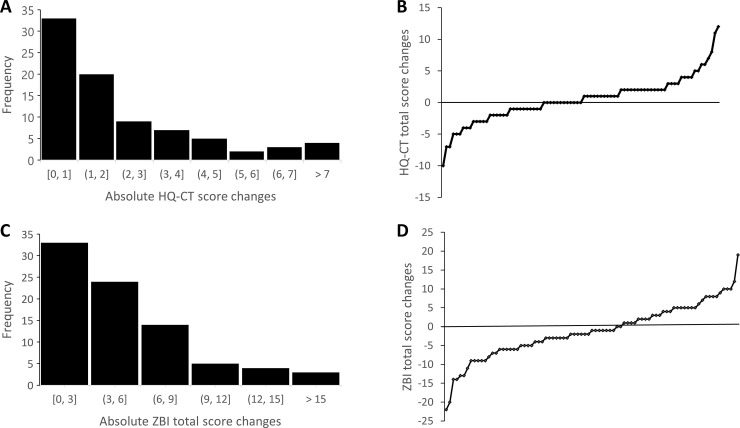
Global changes over 6 months of individual HQ-CT (upper panel) and ZBI total score (lower panel). Frequency distribution of absolute changes in 6 months of (A) HQ-CT total score with 1-unit increment and (C) ZBI total score with 3 points increment. B and D. Waterfall plot of (B) HQ-CT total score and (D) ZBI total score changes in 6 months.

