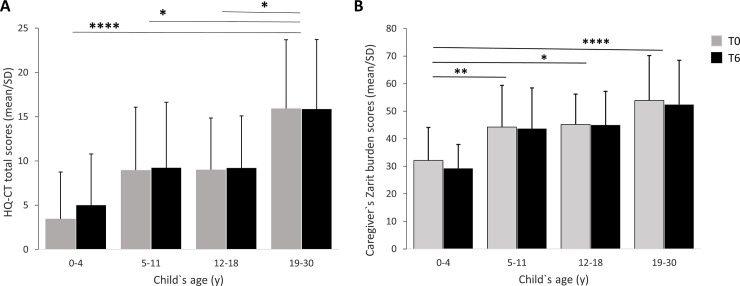
Fig 7.
6-month variation of HQ-CT total score (A) and ZBI total score (B) as a function of the age of individuals with PWS. The 31 y and older age group which comprised only 4 individuals was included into the analysis but not represented in the figure. (A) HQ-CT scores varied significantly across the 5-age groups of individuals with PWS with no score difference at baseline (T0) and at 6 months (T6). *p < 0.05, ****p < 0.0001 when compared to 19–30 y category. (B) ZBI scores varied significantly across the 5-age groups of individuals with PWS with no score difference at baseline (T0) and at 6 months (T6). *p < 0.05, **p < 0.005, ****p < 0.0001 when compared to 0–4 y age category.

