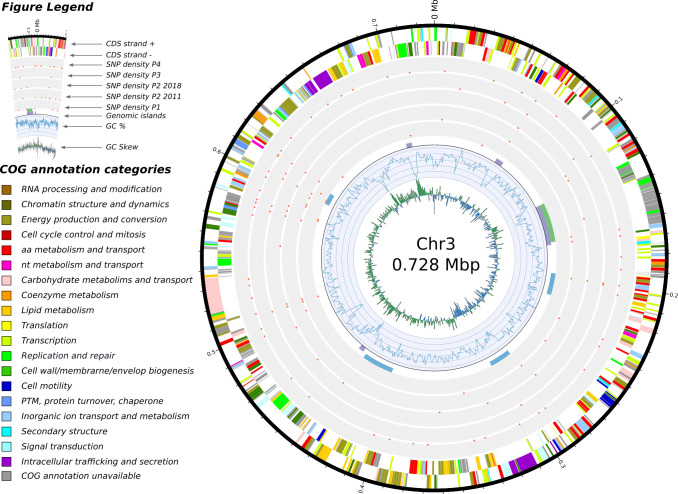
Fig 7. Feature of chromosome 3 and SNP densities comparisons.
In concentric circles, from the center and outward are depicted: 1) the GC skew, 2) the GC content, 3) the genomic islands detected by the software IslandViewer 4 (in purple), the prophages detected with Phaster (green) and the secondary metabolites identified by antiSMASH (in blue), 4) a total of five SNP densities, we separated the isolates from 2011 and the isolate from 2018 in patient 2 as we regard them as two separate acquisition events, 5) and 6) the annotated features found on the negative and positive strand respectively.

