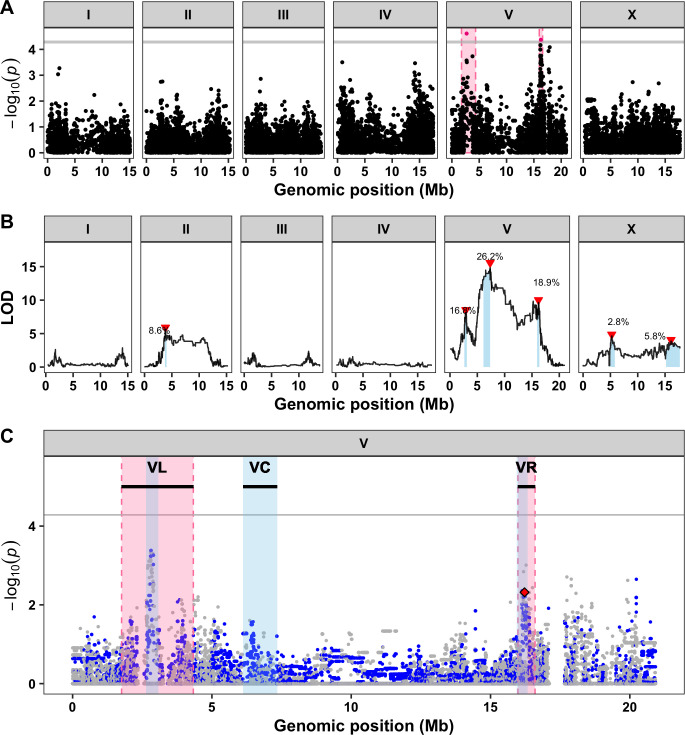
Fig 1. Three large-effect QTL on chromosome V control differences in abamectin responses.
A) Genome-wide association mapping results for animal length (mean.TOF) are shown. Genomic position (x-axis) is plotted against the -log10(p) value (y-axis) for each SNV. SNVs are colored pink if they pass the genome-wide eigen-decomposition significance threshold designated by the grey line. The genomic regions of interest that pass the significance threshold are highlighted by pink rectangles. B) Linkage mapping results for optical density (mean.EXT) are shown. Genomic position (x-axis) is plotted against the logarithm of the odds (LOD) score (y-axis) for 13,003 genomic markers. Each significant QTL is indicated by a red triangle at the peak marker, and a blue rectangle covers the 95% confidence interval around the peak marker. The percentage of the total variance in the RIAIL population that can be explained by each QTL is shown above the QTL. C) Fine mapping of all common variants on chromosome V is shown. Genomic position (x-axis) is plotted against the -log10(p) values (y-axis) for each variant and colored by the genotype of the variant in the CB4856 strain (grey = N2 reference allele, blue = variation from the N2 reference allele). Genomic regions identified from linkage mapping analysis are highlighted in blue and genomic regions identified from association mapping are highlighted in pink. The horizontal grey line represents the genome-wide eigen-decomposition significance threshold. The red diamond represents the most significant variant in the gene glc-1.

