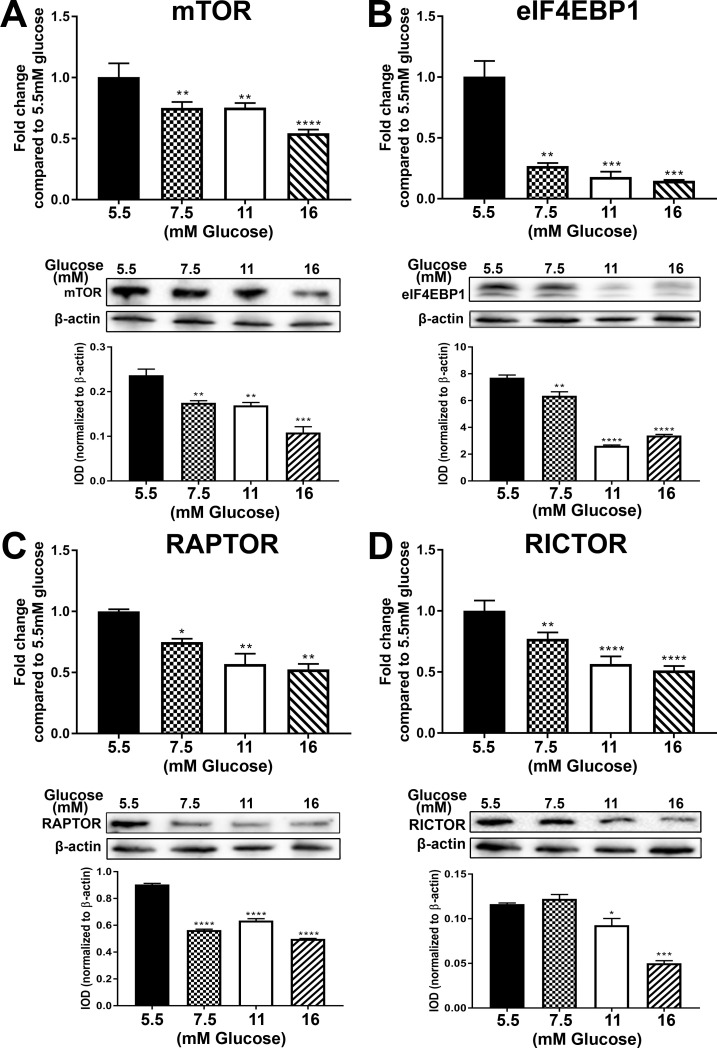
Fig 4. Expression of mTOR and associated genes.
Cultures of hRTE cells were treated with 5.5 mM, 7.5 mM, 11 mM and 16 mM glucose for 3 passages. RT-qPCR and Western blot analysis of (A) mTOR; (B) EIF4EBP1; (C) RAPTOR; (D) RICTOR. The top graphs in the figure represent the PCR data whereas the bottom graphs represent the IOD of the Western blot analysis. ****; ***; **; * indicates significant differences in gene expression level compared to the control 5.5mM glucose concentration at p-value of ≤ 0.0001; ≤ 0.001; ≤ 0.01; ≤ 0.05 respectively.

