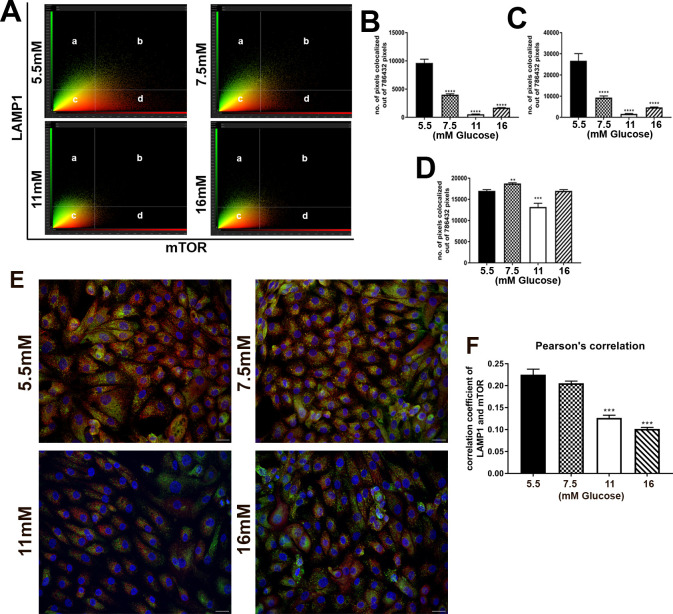
Fig 6. Colocalization of mTOR and LAMP1 in hRTE cell cultures.
Human RTE cells were treated with 5.5 mM, 7.5 mM, 11 mM and 16 mM glucose concentrations for 3 passages. (A) Scatterplot analysis of immunocolocalized mTOR (red) and LAMP1 (green) proteins in which (a) represents pixels that determine LAMP1 staining; (b) represents colocalized mTOR as well as LAMP1 pixels; (d) represents pixels that determine mTOR staining; (c) represents pixels below the threshold. (B) Graphical representation of number of immunocolocalized mTOR and LAMP1 pixels. (C) Graphical representation of number of pixels that determines mTOR staining only. (D) Graphical representation of number of pixels that determines LAMP1 staining only. (E) Double stained immunofluorescence images for mTOR (red) and LAMP1 (green). Nuclei are stained with DAPI (blue). (F) Colocalization based on Pearson’s correlation. ****; ***; ** indicates significant differences in gene expression level compared to the control 5.5mM glucose concentration at p-value of ≤ 0.0001; ≤ 0.001; ≤ 0.01 respectively. Scale bar = 21.16 μm. Magnification x400.

