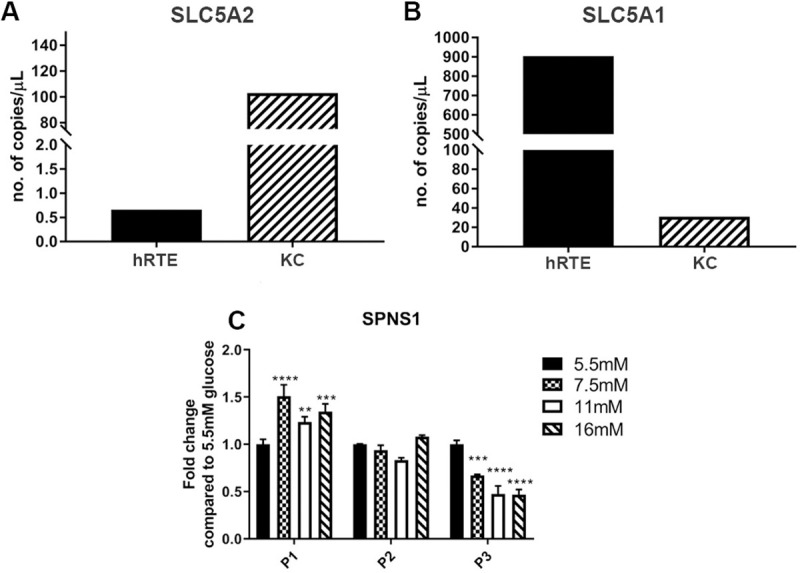
Fig 7. Expression of Na+- glucose transporters and sphingolipid transporter in cultures of hRTE cells and human kidney cortex tissue (KC).

Expression of (A) SLC5A2 and (B) SLC5A1 in hRTE cells and kidney cortex (KC) total RNA sample. PCR analysis sample concentrations are plotted as copies per μl. (C) Expression of sphingolipid transporter 1 (SPNS1) in the hRTE cultures treated with 5.5 mM, 7.5 mM, 11 mM and 16 mM glucose concentrations at passage one, two and three. ****; ***; ** indicates significant differences in gene expression level compared to the control 5.5 mM glucose concentration at p-value of ≤ 0.0001; ≤ 0.001; ≤ 0.01 respectively.
