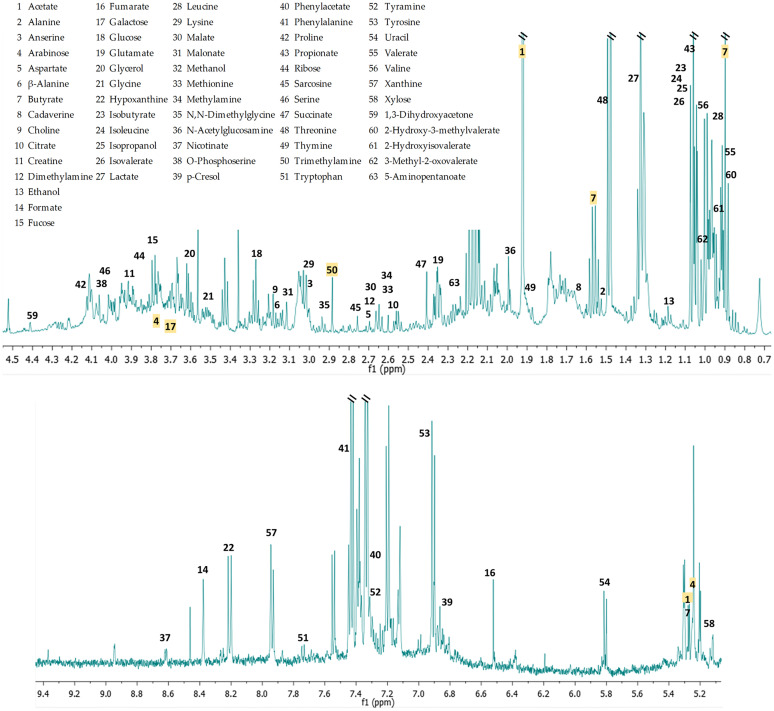
Fig 1. Representative 1H NMR spectrum.
63 identified metabolites. Compounds in yellow are the five significantly different (p < 0.05) metabolites based on one-way ANOVA. For visual clarity, with the exception of the five significant metabolites, compounds are only listed once in the spectra regardless of their actual number of spectral peaks. The water region (4.5 to 5.2 ppm) has been excluded.

