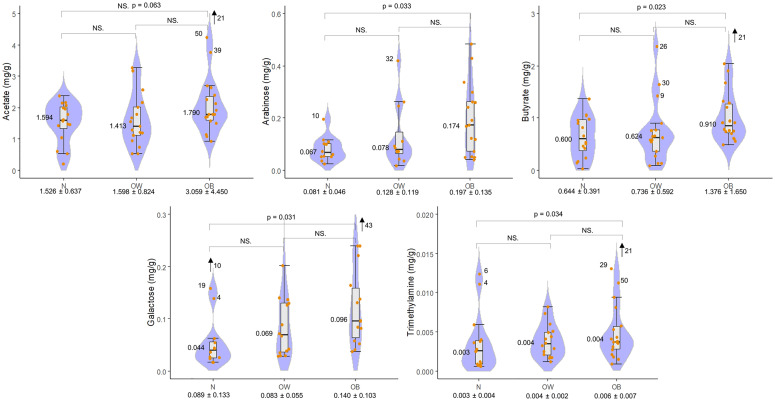
Fig 2. Metabolite concentration (mg/g) boxplots.
Significantly different (p < 0.05) metabolites among the N, OW, and OB groups based on one-way ANOVA (significance found only between N and OB groups after post-hoc test. Acetate was not significant after application of post-hoc test). The x-axis shows the group name and the mean ± standard deviation. The numbers and text in the graphical area represent: the post-hoc p-value where significant, NS. = not significant, the median and the sample numbers that lie outside the visible range area.

