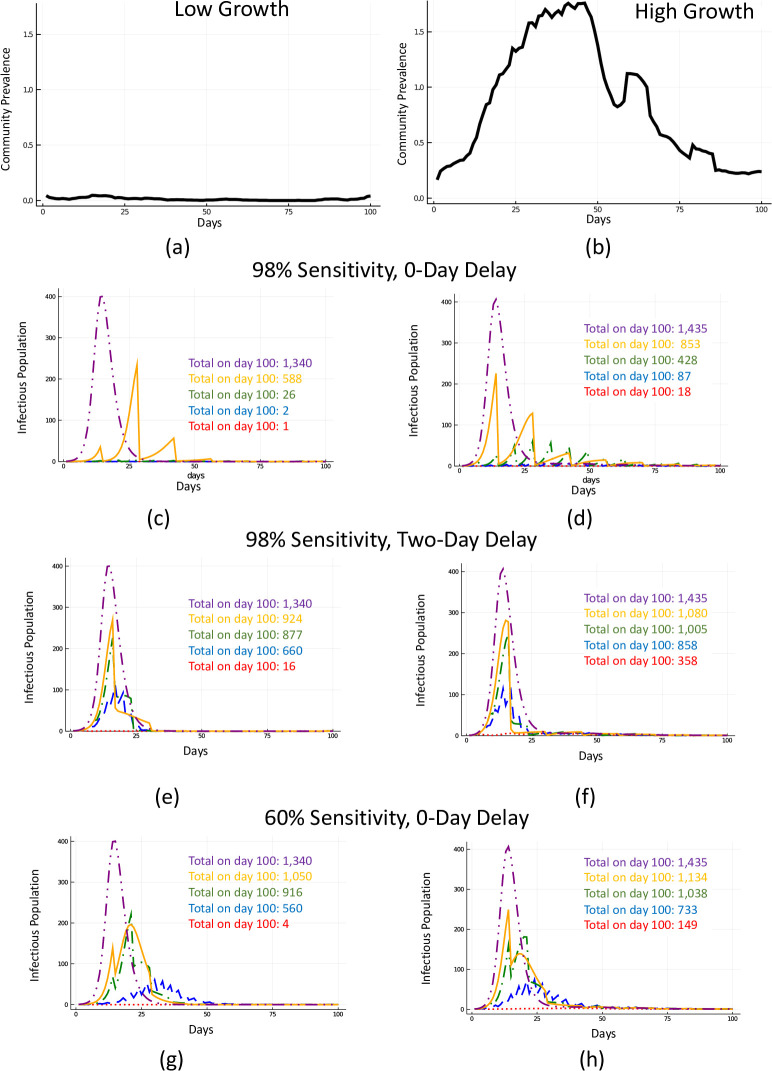
Fig 2. Impact of testing frequency.
Two scenarios for community prevalence corresponding, relatively, to low and high rates of imported infections (Panels (a) and (b)). Testing with a test with 98% sensitivity with 0-day resulting delay amidst high and low community prevalence (Panels (c) and (d)). Testing with a test with 98% sensitivity with 2-day resulting delay amidst high and low community prevalence (Panels (e) and (f)). Testing with a test with 60% sensitivity with 0-day resulting delay amidst high and low community prevalence (Panels (g) and (h)). Purple (dash-dot-dot) corresponds to no testing, orange (solid) to testing every two weeks with daily symptom tracking, green for testing every week with daily symptom tracking (dash-dot), blue (dash) for testing every 3 days with daily symptom tracking, and red (dot) for daily testing and symptom tracking.

