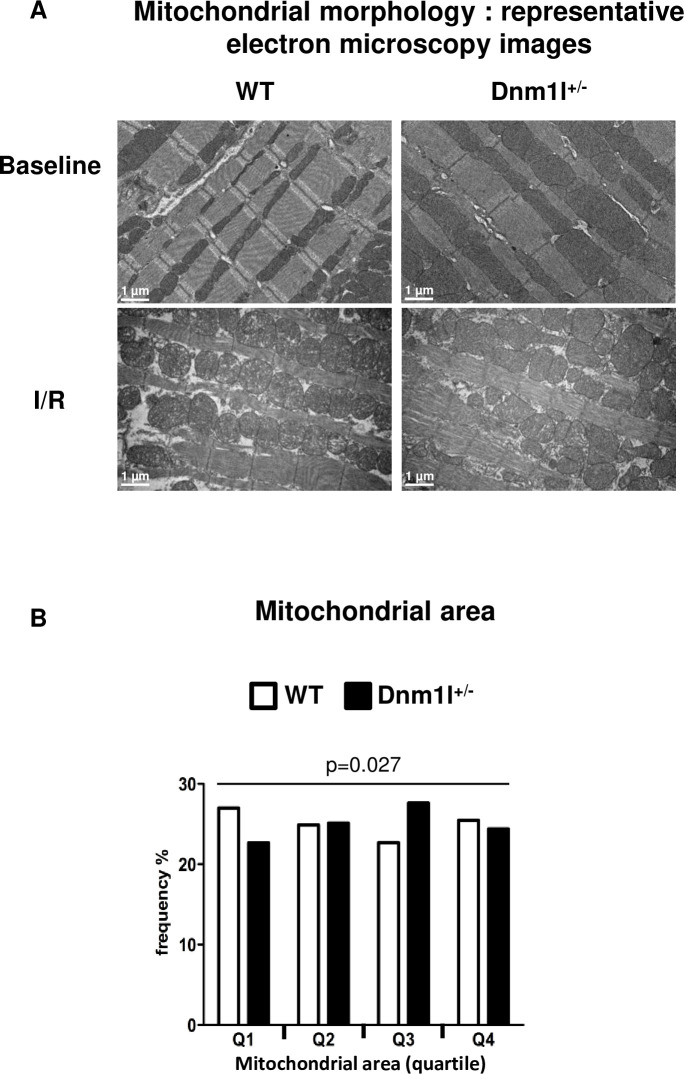
Fig 4. Mitochondrial morphology.
(A) Representative electron microscopy (EM) images of left ventricle longitudinal sections at baseline and after 30 minutes of ischemia and 24 hours of reperfusion in 3-month-old Dnm1l+/- and WT mice. Scale bar: 1 μm. (B) Mitochondrial frequency represented according to the quartile distribution of the mitochondrial area. Counting was performed on 60 representative EM fields per group (n = 4 per group).

