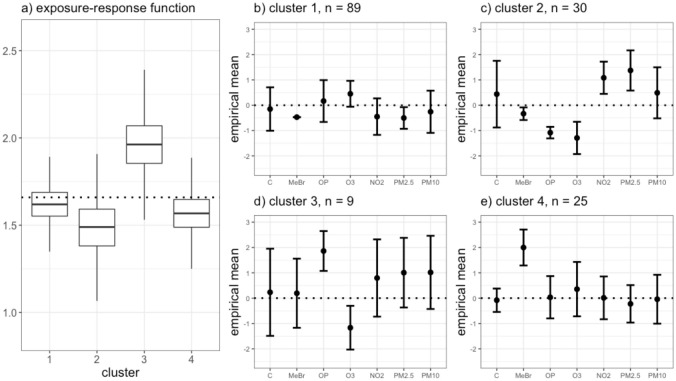
Fig 3. Results from analysis of FACES data set using SPR.
Panel (a) shows the distribution of the model averaged estimated exposure-response function (θc) for each cluster identified in the best clustering by SPR. The dotted line represents the overall mean estimated exposure-response function across all clusters. Panels (b-e) show the empirical exposure means of the individuals assigned to each cluster in the best clustering, with 1 standard deviation error bars. The dotted lines are drawn at 0, the mean of the standardized exposure data.

