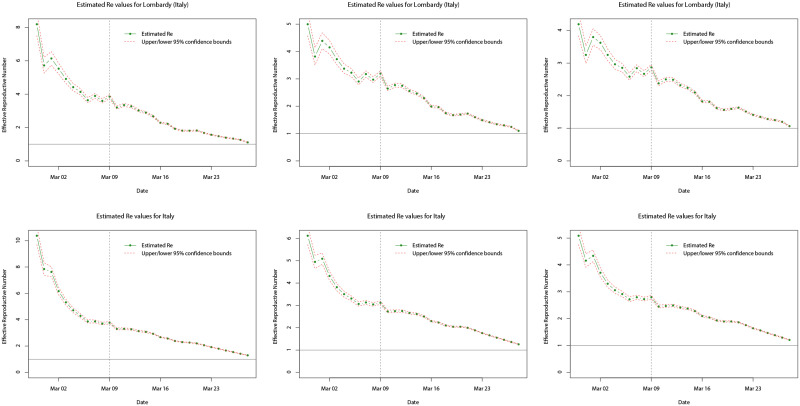
Fig 17. Plots of the estimated mean Re values (dot-dashed green line) for Lombardy (top row) and Italy (bottom row) over the whole sample period, using serial interval distributions SI1 (left), SI2 (middle), and SI3 (right).
Upper and lower limits of the 95% confidence intervals for the mean are indicated by the red dashed lines, and the grey dotted line indicates the date at which the national lock down becomes effective.

