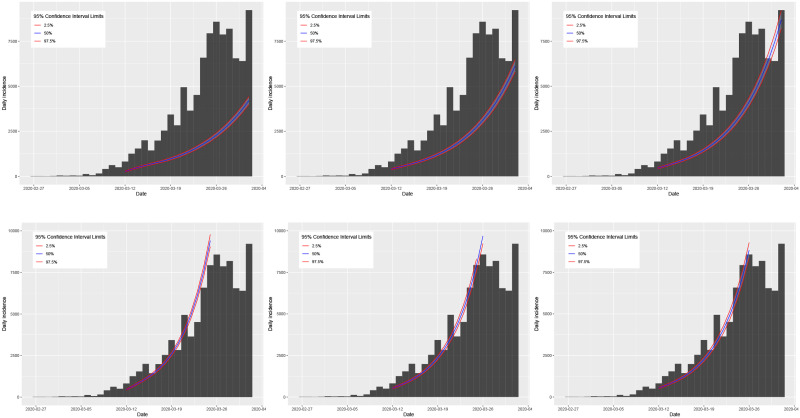
Fig 20. Plots of the observed daily incidence (histograms) in Spain during its growth phase and the predicted daily incidence (purple solid line) estimated using the SIR model (top row) and log-linear model (bottom row) assuming serial interval distributions of SI1 (left), SI2 (middle), and SI3 (right).
95% confidence intervals for the predicted incidence are indicated by the shaded light purple regions.

