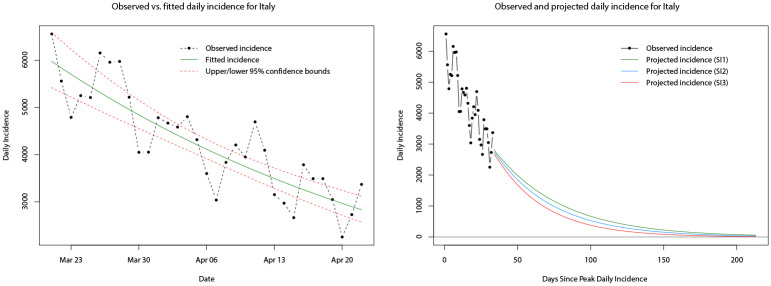
Fig 21. Plots of the observed (dot-dashed black line) and fitted daily incidence (solid green line) for Italy during its decay phase, with upper and lower limits of the 95% confidence interval indicated by the red dashed lines (left).
Plots of the observed (dot-dashed black line) and projected daily incidence for the next 180 days using the log-linear model and serial interval distributions SI1 (green line), SI2 (blue line), and SI3 (red line) (right).

