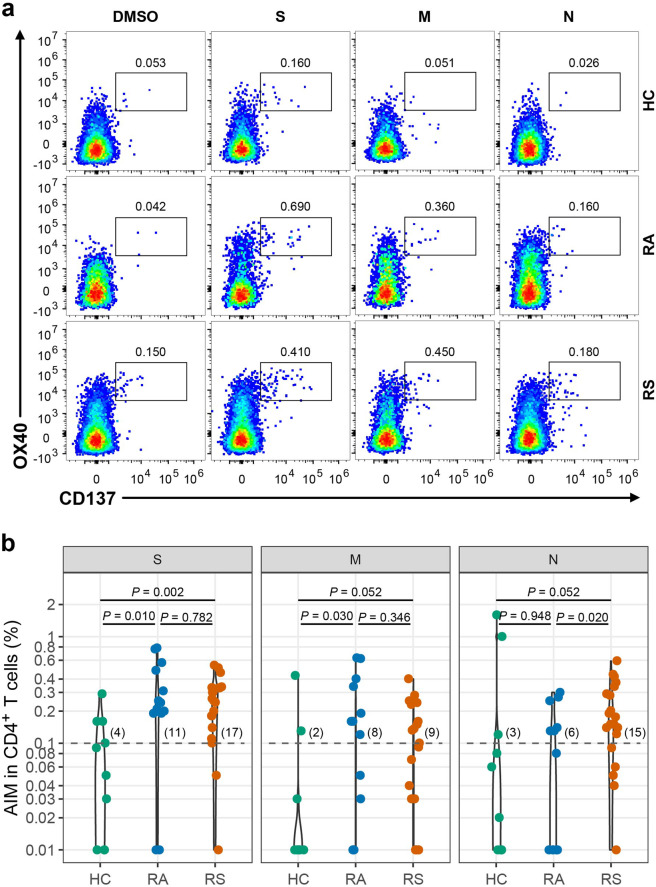
Fig. 3. SARS-CoV-2 specific CD4+ T cell response of recovered COVID-19 individuals.
a Representative flow plots for the expressions of OX40 and CD137 within CD3+CD4+ T cells of cultured PBMCs stimulated with SARS-CoV-2 peptide library in different subjects. b SARS-CoV-2-specific CD4+ T cells measured as percentage of AIM+ (OX40+CD137+) after stimulation of PBMCs with peptide pools encompassing S, M, and N. Each symbol represents an individual throughout. RS, individuals recovered from COVID-19 with symptoms (n = 20); RA, individuals recovered from asymptomatic (n = 13); HC, healthy controls (n = 10). Data were background subtracted against DMSO negative control, and if the value is greater than 0.1%, the individual is considered as response to peptide library stimulation. The number of response individuals is shown in brackets, and the dotted line indicated the cut-off for positive responder. The comparisons between two groups were performed by using unpaired, two-sided Mann–Whitney U test. S, spike; M, membrane; N, nucleocapsid.

