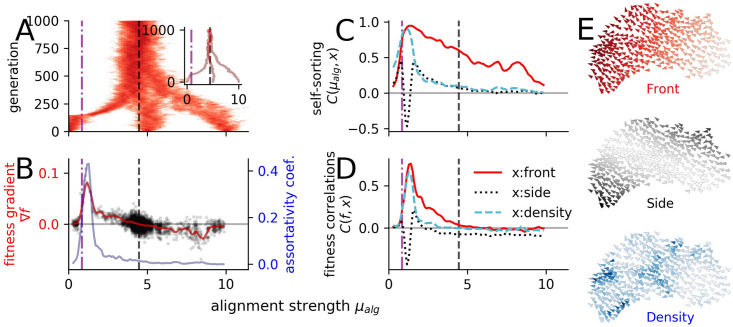
Fig 3. Evolution under predation.
(A) Overlay of three independent evolutionary runs starting at 〈μalg〉 = [0, 5, 10] over 1000 generations. The behavioral phenotype is determined only by the alignment strength as the evolving parameter. The predator attacks from random initial directions for Tsimu = 120. The inset shows the evolution of the population mean alignment parameter 〈μalg〉 of the three different evolutionary runs. (B) Assortativity coefficient () and smoothed fitness gradient ∇f (). The evolutionary stable state is defined by the zero crossing of the fitness gradient and represented as a vertical dashed black line. Black dots are the non-averaged fitness gradients for each generation (see Methods). (C) Self-sorting measured as correlation C(μalg, x) between the individual alignment strength μalg and variables quantifying its (spatial) location within the school: front-back position () and side-center position (black) and local density (). (D) Correlation C(f, x) of individual fitness with the average relative spatial positions. (E) Simulation snapshot illustrating the location variables: front-back position () and side-center position (black) and local density (). In all panels: the vertical dash-dotted magenta line marks the order-disorder transition and the vertical dashed black line the evolutionary stable state.

