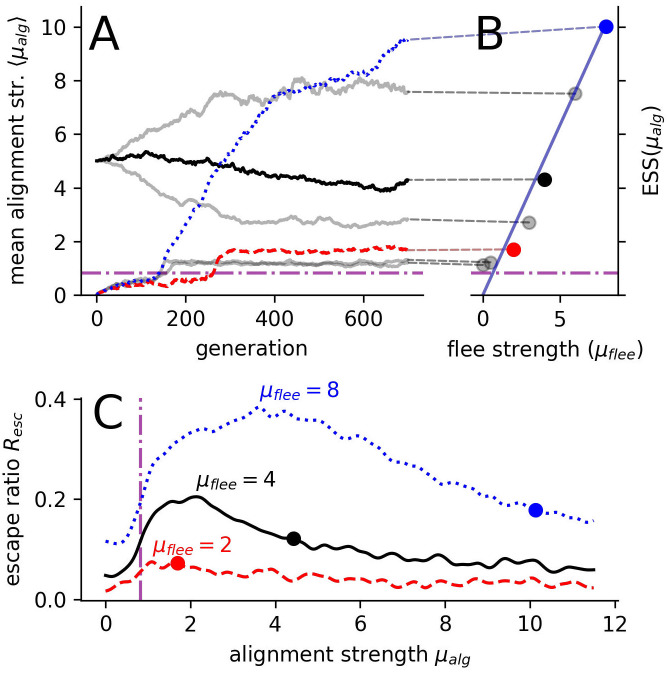
Fig 4. Evolution for different flee strengths μflee.
(A) Sample evolutionary trajectories of the mean alignment strength μalg over 700 generations. (B) shows the dependence of evolutionary stable strategies (ESS) on the flee strength μflee. Solid diagonal line shows the theoretically predicted linear dependence of the ESS on μflee assuming balancing of social and private information (see SI Sec. VI). Dashed lines (A, B) connect the example individual evolutionary runs (A) to the corresponding ESSs (B) obtained as an average over multiple, longer evolutionary simulations. (C) Evolutionary stable states (circles) with respect to the group response, measured via the escape ratio Resc, for three selected flee-strengths indicated with dashed, solid and dotted lines for μflee = [2, 4, 8] respectively. In all panels: the dash-dotted magenta line marks the order-disorder transition and the different lines/points (red, black and blue) represent results for different flee strengths μflee = [2, 4, 8], respectively.

