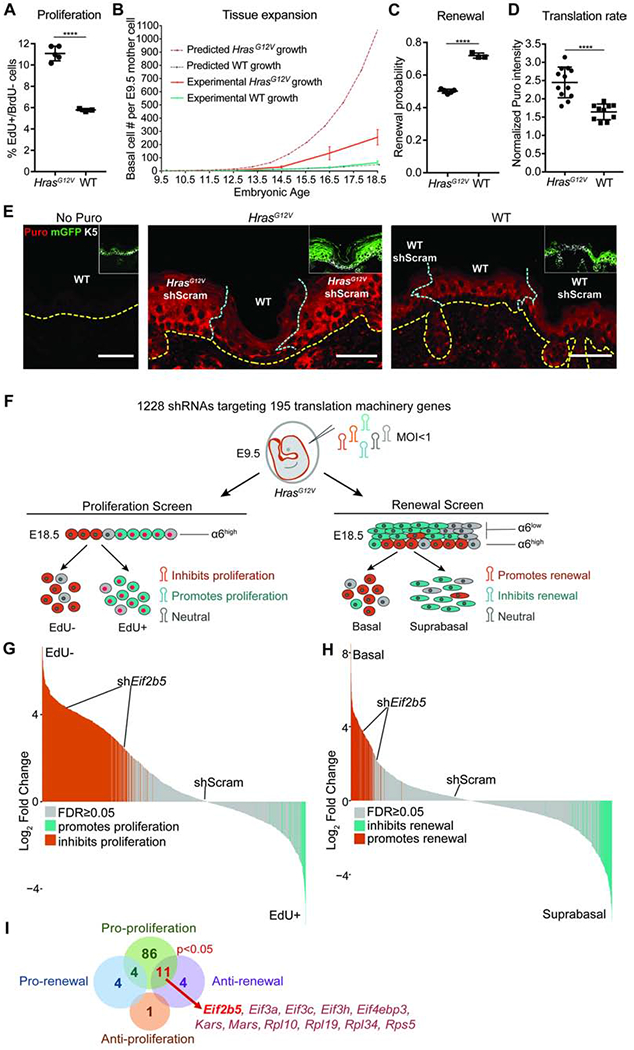
Figure 1. Oncogenic HRAS activation induces translationally regulated progenitor cell behaviors.

A) Proliferation rate in IFE basal progenitor cells transduced with control shRNA. n=4 HrasG12V and 3 WT animals. Approx. 100 basal cells were scored per animal.
B) Predicted (dashed lines) and experimentally observed (solid lines) tissue growth derived from a single progenitor cell at E9.5. Predicted tissue growth is based on observed progenitor cell proliferation rates (Figure 1A) and renewal probability=0.7 (Ying et al., 2018). n=3 animals per timepoint per condition.
C) Progenitor cell renewal probability in IFE basal cells transduced with control shRNA. n=4 HrasG12V and 3 WT animals. Approx. 100 cell divisions were scored per animal.
D) Translation rate as measured by in vivo puromycin incorporation. HrasG12V and WT epidermis were transduced with control shRNA. Puromycin intensity in transduced IFE basal cells was normalized to underlying dermal puromycin intensity. n=12 HrasG12V and 11 WT imaging fields containing epidermis and dermis. 3 animals per condition were assessed.
E) Representative immunofluorescence staining of puromycin incorporation (red) in transduced (mGFP+, green, inset) IFE basal cells (K5+, white, inset) at E18.5. HrasG12V and WT epidermis were transduced with control shRNA. No-puro control used skin from vehicle-only injected WT mice. Yellow dashed line marks basement membrane; blue dashed line marks border of transduced epidermis. Scale bars, 50μm.
F) In vivo genetic screens to identify epidermal progenitor proliferation and renewal regulators. Assays are based on enrichment (orange) or depletion (blue) of shRNAs in non-dividing EdU− relative to dividing EdU+ epidermal progenitors (proliferation screen) or α6-Integrinhigh basal progenitors relative to α6-Integrinlow differentiated suprabasal cells (renewal screen).
G-H) Needle plots show fold change for individual shRNAs in (G) proliferation and (H) renewal screens. n=3 biological replicates (DESeq2 FDR<0.05).
I) Overlap of renewal and proliferation screens reveals regulators of HrasG12V basal progenitor behaviors. Hypergeometric test used to analyze significance of gene overlap.
Mean and SD are shown. Unpaired two-tailed t test used to determine statistical differences. ****:P-value<0.0001. See also Figure S1 and Table S1.
