


Figure 2. Oncogenic HRAS-induced progenitor cell behaviors and tissue growth are dependent on eIF2B5.
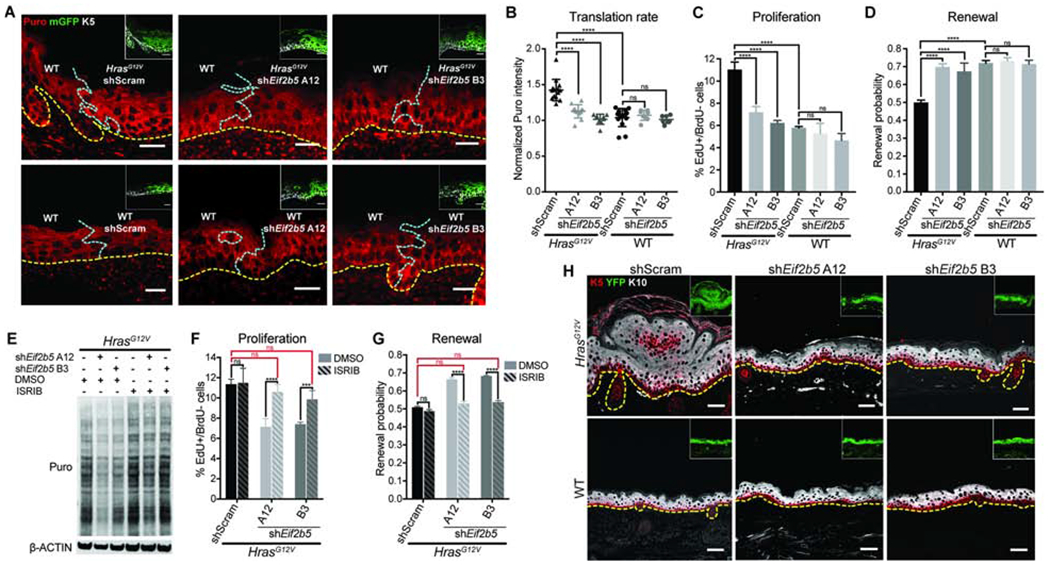
A-B) Representative (A) immunofluorescence staining and (B) quantification of puromycin incorporation (red) in transduced (mGFP+, green, inset) IFE basal cells (K5+, white, inset), normalized to neighboring untransduced basal cells (K5+mGFP-). Yellow dashed line marks basement membrane; blue dashed line marks border of transduced epidermis. n=12 HrasG12V+shScram, 12 HrasG12V+shEif2b5 A12, 9 HrasG12V+shEif2b5 B3, 13 WT+shScram, 9 WT+shEif2b5 A12, and 9 WT+shEif2b5 B3 imaging fields containing transduced and untransduced epidermis. 3 animals per condition were assessed. Scale bars, 25 μm.
C-D) (C) Proliferation rate and (D) renewal probability in transduced IFE basal progenitor cells. n=3 animals per condition. Approx. 100 basal cells (for proliferation assay) or 100 cell divisions (for renewal assay) were scored per animal.
E) Western blot of puromycin incorporation (Puro) in transduced primary keratinocytes treated with DMSO or ISRIB.
F-G) (F) Proliferation rate and (G) renewal probability in transduced IFE basal progenitor cells treated with DMSO or ISRIB. n=3 animals per condition. Approx. 100 basal cells (for proliferation assay) or 100 cell divisions (for renewal assay) were scored per animal. Key comparisons shown in red.
H) Representative immunofluorescence staining of keratin 5 (K5, red) and keratin 10 (K10, white) in transduced E18.5 epidermis. Cre reporter YFP (green) marks the transduced epidermis (inset). Dashed line marks the basement membrane. Scale bars, 50μm.
Mean and SD are shown. ANOVA with Tukey’s range test for multiple comparisons used to determine statistical differences. *:P-value<0.05; ***:P-value<0.001; ****:P-value<0.0001; ns=not significant. See also Figure S2.