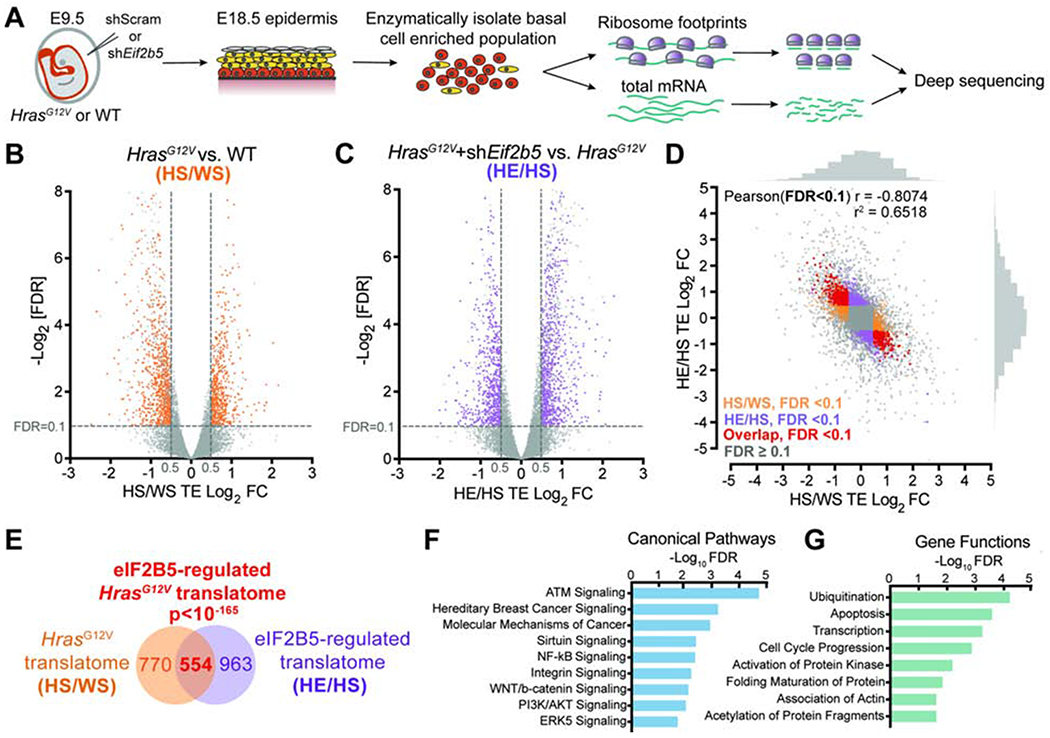
Figure 3. eIF2B5 regulates translation of a specific subset of HrasG12V-dependent mRNAs.

A) In vivo basal cell ribosome profiling strategy. Transduced epidermis was enzymatically digested at E18.5 to yield a basal cell enriched population for profiling.
B-C) Volcano plots of translation efficiency (TE) changes in E18.5 basal cells comparing (B) HrasG12V+shScram (HS) with WT+shScram (WS) and (C) HrasG12V+shEif2b5 (HE) with HrasG12V+shScram (HS). Significant genes (colored) have Log2TE fold change>0.5, FDR<0.1 (dashed lines) by Xtail analysis and insignificant transcriptional changes by EdgeR analysis (FDR>0.1 or Log2FC<0.5). n=3 biological replicates.
D-E) Comparison of genes with significant translation efficiency changes in (B) (HS/WS; in orange) and (C) (HE/HS; in purple) reveals (D) negative correlation and (E) significant overlap (in red). The overlapping gene set comprises the eIF2B5-regulated HrasG12V translatome. Pearson’s X2 test used to analyze correlation of genes with significant translation efficiency, and hypergeometric test used to analyze overlap of gene sets.
F-G) Ingenuity pathway analysis of overlapping genes for enriched (F) canonical pathways and (G) gene functions.
