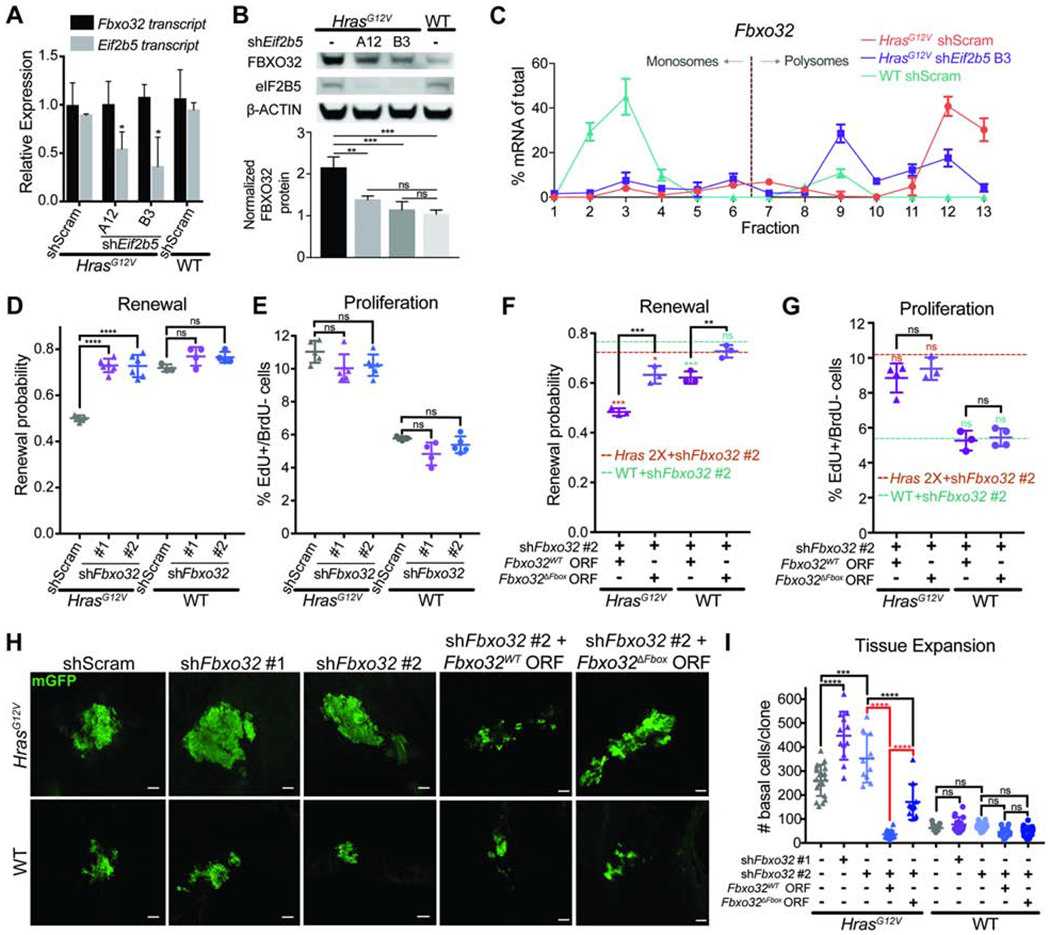
Figure 5. FBXO32 is translationally regulated by eIF2B5 and drives loss of renewal in HrasG12V epidermal progenitors.

A) mRNA expression analysis by qPCR in E18.5 basal cells. n=3 animals per condition.
B) Representative western blot in transduced basal cells. FBXO32 protein level was normalized to ß-ACTIN for quantification. n=3 biological replicates.
C) qPCR of polysome fractions for Fbxo32 in primary HrasG12V keratinocytes transduced with control shRNA or shE/72b5.
D-E) (D) Renewal probability and (E) proliferation rate in transduced IFE basal cells. n=5 HrasG12V+shScram, 5 HrasG12V+shFbxo32 #1, 6 HrasG12V+shFbxo32 #2, 3 WT+shScram, 4 WT+shFbxo32 #1, and 5 WT+shFbxo32 #2 animals. Approx. 100 cell divisions (for renewal assay) or 100 basal cells (for proliferation assay) were scored per animal.
F-G) (F) Renewal probability and (G) proliferation rate in IFE basal cells transduced with shFbxo32 #2 co-expressing Fbxo32WT or Fbxo32ΔFbox ORF. Dashed lines represent average renewal probability or proliferation rate when HrasG12V (orange) or WT (green) epidermis is transduced with shFbxo32 #2 alone. Colored asterisks represent significant differences when compared to dataset indicated by colored dashed lines. n=3 animals per condition. Approx. 100 cell divisions (for renewal assay) or 100 basal cells (for proliferation assay) were scored per animal.
H-I) Representative (H) immunofluorescence staining and (I) quantification of basal cell numbers per clone in transduced E18.5 epidermis. mGFP (green) marks transduced cells. n=18 HrasG12V+shScram, 12 HrasG12V+shFbxo32 #1, 11 HrasG12V+shFbxo32 #2, 18 HrasG12V+shFbxo32 #2+Fbxo32WT, 11 HrasG12V+shFbxo32 #2+Fbxo32ΔFbox, 15 WT+shScram, 16 WT+shFbxo32 #1, and 12 WT+shFbxo32 #2, 15 WT+shFbxo32 #2+Fbxo32WT, and 16 WT+shFbxo32 #2+Fbxo32ΔFbox clones. 3 animals were assessed per condition. Key comparisons shown in red. Scale bars, 50μm.
Mean and SD are shown. ANOVA with Tukey’s range test for multiple comparisons used to determine statistical differences. *:P-value<0.05; **:P-value<0.01; ***:P-value<0.001; ****:P-value<0.0001; ns=not significant. See also Figure S5.
