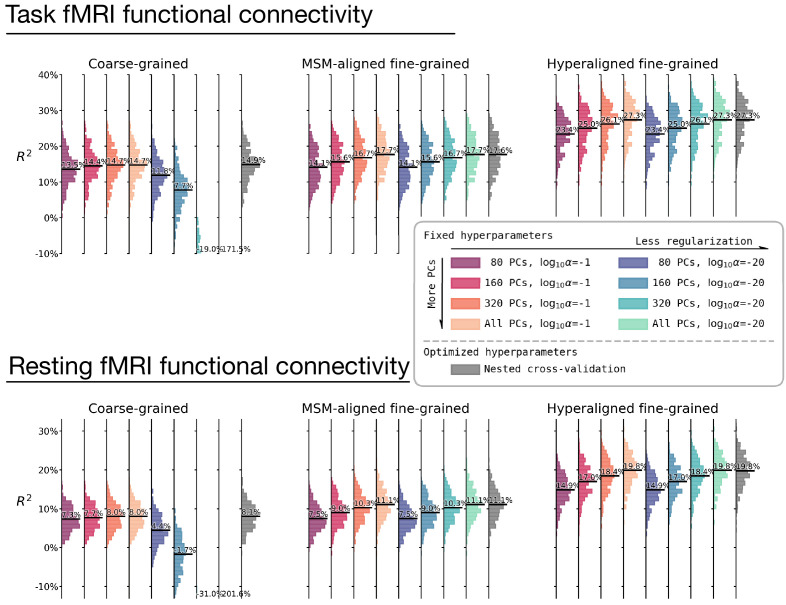
Appendix 1—figure 10. The effect of hyperparameter choices on prediction performance.
Besides using fine-tuned hyperparameters based on nested cross-validation (rightmost columns in gray), we trained prediction models based on another eight sets of hyperparameter choices. These eight sets of hyperparameters are combinations of four levels of dimensionality reduction (80 principal components [PCs], 160 PCs, 320 PCs, or all PCs) and two levels of regularization (α = 0.1 or α = 10−20). These hyperparameter levels are the levels most frequently chosen based on nested cross-validation (Appendix 1—figure 5). The histograms denote R2 distribution across brain regions, and horizontal bars are the average R2 across regions. For prediction models based on coarse-grained connectivity profiles, regularization is critical for prediction model performance, and with insufficient regularization models overfit dramatically with more PCs. When the regularization is large enough, the model performance slightly increases with higher number of PCs. For prediction models based on fine-grained connectivity profiles, model performance is hardly affected by regularization level and consistently increases with higher number of PCs. This suggests that PCs based on fine-grained connectivity profiles contain more information related to individual differences in intelligence and less noise. Note that even with only 80 PCs prediction models based on hyperaligned fine-grained connectivity profiles still account for approximately two times more variance than those based on coarse-grained connectivity profiles.

